Pyopls
A Python 3 implementation of orthogonal projection to latent structures
This package provides a scikit-learn-style transformer to perform OPLS. OPLS is a pre-processing method to remove variation from the descriptor variables that are orthogonal to the target variable (1). The project is written primarily in Python, distributed under the MIT License license, first published in 2019. Key topics include: chemometrics, feature-selection, metabolomics, orthogonal-signal-correction, partial-least-squares-regression.
pyopls - Orthogonal Projection to Latent Structures in Python.

This package provides a scikit-learn-style transformer to perform OPLS.
OPLS is a pre-processing method to remove variation from the descriptor
variables that are orthogonal to the target variable (1).
This package also provides a class to validate OPLS models using a
1-component PLS regression with cross-validation and permutation tests (2)
for both regression and classification metrics (from permutations of the
target) and feature PLS loadings (from permutations of the features).
Table of Contents
Installation
pyopls is available via pypi:
shellpip install pyopls
You may also install directly from this repository for the current
master:
shellpip install git+git://github.com/BiRG/pyopls.git
New versions are uploaded to pypi whenever the version number is
incremented in setup.py on the master branch.
Notes
- The implementation provided here is equivalent to that of the
libPLS MATLAB library, which is a faithful
recreation of Trygg and Wold's algorithm.- This package uses a different definition for R<sup>2</sup>X, however (see
below)
- This package uses a different definition for R<sup>2</sup>X, however (see
OPLSinheritssklearn.base.TransformerMixin(like
sklearn.decomposition.PCA) but does not inherit
sklearn.base.RegressorMixinbecause it is not a regressor like
sklearn.cross_decomposition.PLSRegression. You can use the output of
OPLS.transform()as an input to another regressor or classifier.- Like
sklearn.cross_decomposition.PLSRegression,OPLSwill center
both X and Y before performing the algorithm. This makes centering by
class in PLS-DA models unnecessary. - The
score()function ofOPLSperforms the R<sup>2</sup>X score, the
ratio of the variance in the transformed X to the variance in the
original X. A lower score indicates more orthogonal variance removed. OPLSonly supports 1-column targets.
Examples
OPLS and PLS-DA
A CSV file containing 1H-NMR spectra for 118 serum samples of patients
with colon cancer diagnoses and healthy controls is located in
colorectal_cancer_nmr.csv in the root of this repository (see
acknowledgment below).
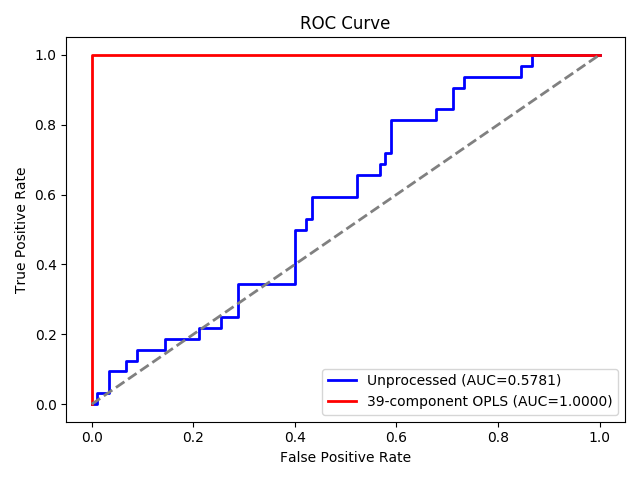
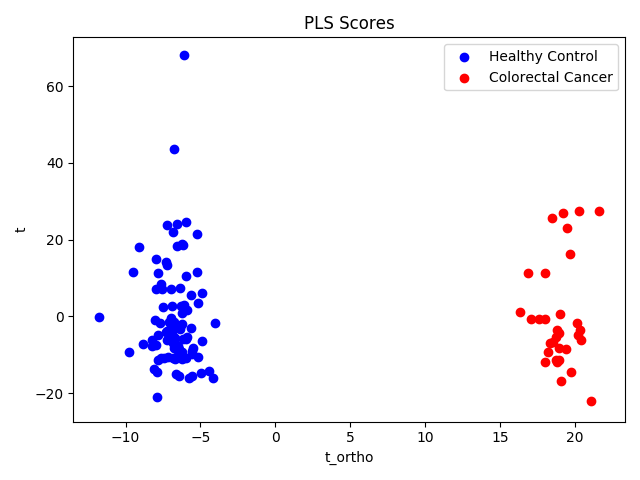
OPLS-processed data require only 1 PLS component. Performing a
39-component OPLS improves cross-validated accuracy from 70% to 100%,
AUC from .578 to 1 and DQ<sup>2</sup> (3) from 0.04 to 0.99.
pythonimport pandas as pd import numpy as np import matplotlib.pyplot as plt from sklearn.metrics import roc_curve, roc_auc_score from pyopls import OPLS from sklearn.cross_decomposition import PLSRegression from sklearn.model_selection import cross_val_predict, LeaveOneOut from sklearn.metrics import r2_score, accuracy_score spectra = pd.read_csv('colorectal_cancer_nmr.csv', index_col=0) spectra = spectra[spectra.classification.isin(['Colorectal Cancer', 'Healthy Control'])] target = spectra.classification.apply(lambda x: 1 if x == 'Colorectal Cancer' else -1) spectra = spectra.drop('classification', axis=1) opls = OPLS(39) Z = opls.fit_transform(spectra, target) pls = PLSRegression(1) y_pred = cross_val_predict(pls, spectra, target, cv=LeaveOneOut()) q_squared = r2_score(target, y_pred) # -0.107 dq_squared = r2_score(target, np.clip(y_pred, -1, 1)) # -0.106 accuracy = accuracy_score(target, np.sign(y_pred)) # 0.705 processed_y_pred = cross_val_predict(pls, Z, target, cv=LeaveOneOut()) processed_q_squared = r2_score(target, processed_y_pred) # 0.981 processed_dq_squared = r2_score(target, np.clip(processed_y_pred, -1, 1)) # 0.984 processed_accuracy = accuracy_score(target, np.sign(processed_y_pred)) # 1.0 r2_X = opls.score(spectra) # 7.8e-12 (most variance is removed) fpr, tpr, thresholds = roc_curve(target, y_pred) roc_auc = roc_auc_score(target, y_pred) proc_fpr, proc_tpr, proc_thresholds = roc_curve(target, processed_y_pred) proc_roc_auc = roc_auc_score(target, processed_y_pred) plt.figure(0) plt.plot(fpr, tpr, lw=2, color='blue', label=f'Unprocessed (AUC={roc_auc:.4f})') plt.plot(proc_fpr, proc_tpr, lw=2, color='red', label=f'39-component OPLS (AUC={proc_roc_auc:.4f})') plt.plot([0, 1], [0, 1], color='gray', lw=2, linestyle='--') plt.xlabel('False Positive Rate') plt.ylabel('True Positive Rate') plt.title('ROC Curve') plt.legend(loc='lower right') plt.show() plt.figure(1) pls.fit(Z, target) df = pd.DataFrame(np.column_stack([pls.x_scores_, opls.T_ortho_[:, 0]]), index=spectra.index, columns=['t', 't_ortho']) pos_df = df[target==1] neg_df = df[target==-1] plt.scatter(neg_df['t'], neg_df['t_ortho'], c='blue', label='Healthy Control') plt.scatter(pos_df['t'], pos_df['t_ortho'], c='red', label='Colorectal Cancer') plt.title('PLS Scores') plt.xlabel('t_ortho') plt.ylabel('t') plt.legend(loc='upper right') plt.show()
ROC Curve
Scores Plot
Validation
The fit() method of OPLSValidator will find the optimum number of
components to remove, then evaluate the results on a 1-component
sklearn.cross_decomposition.PLSRegression model. A permutation test is
performed for each metric by permuting the target and for the PLS
loadings by permuting the features.
This snippet will determine the best number of components to remove,
perform permutation tests for regression metrics and perform two-tailed
permutation tests for each feature (bin) relative to it's loading. The
feature permutation tests for the colorectal cancer dataset would take
quite some time, as they require that the model be fit as many as 874k
times. So instead, we look at the
UCI ML Wine Dataset
provided by
scikit-learn
The feature permutation tests reveal that hue and malic acid do not
differentate class 1 from class 0.
pythonimport pandas as pd from pyopls import OPLSValidator from sklearn.datasets import load_wine wine_data = load_wine() df = pd.DataFrame(wine_data['data'], columns=wine_data['feature_names']) df['classification'] = wine_data['target'] df = df[df.classification.isin((0, 1))] target = df.classification.apply(lambda x: 1 if x else -1) # discriminant for class 1 vs class 0 X = df[[c for c in df.columns if c!='classification']] validator = OPLSValidator(k=-1).fit(X, target) Z = validator.opls_.transform(X) feature_df = pd.DataFrame() feature_df['feature_name'] = wine_data['feature_names'] feature_df['feature_p_value'] = validator.feature_p_values_ feature_df['feature_loading'] = validator.pls_.x_loadings_ print(feature_df.loc[feature_df.feature_loading.abs().sort_values(ascending=False).index].to_markdown()) # Pandas 1.0+ required for to_markdown
Feature importances
| feature_name | feature_p_value | feature_loading | |
|---|---|---|---|
| 12 | proline | 0.00990099 | 0.385955 |
| 9 | color_intensity | 0.00990099 | 0.381981 |
| 0 | alcohol | 0.00990099 | 0.379567 |
| 6 | flavanoids | 0.00990099 | 0.359975 |
| 5 | total_phenols | 0.00990099 | 0.336182 |
| 11 | od280/od315_of_diluted_wines | 0.00990099 | 0.299045 |
| 3 | alcalinity_of_ash | 0.00990099 | -0.239887 |
| 2 | ash | 0.00990099 | 0.22916 |
| 7 | nonflavanoid_phenols | 0.00990099 | -0.224338 |
| 4 | magnesium | 0.00990099 | 0.18662 |
| 8 | proanthocyanins | 0.00990099 | 0.181767 |
| 1 | malic_acid | 0.564356 | 0.0293328 |
| 10 | hue | 0.623762 | 0.0210777 |
References
- Johan Trygg and Svante Wold. Orthogonal projections to latent structures (O-PLS).
J. Chemometrics 2002; 16: 119-128. DOI: 10.1002/cem.695 - Eugene Edington and Patrick Onghena. "Calculating P-Values" in Randomization tests, 4th edition.
New York: Chapman & Hall/CRC, 2007, pp. 33-53. DOI: 10.1201/9781420011814. - Johan A. Westerhuis, Ewoud J. J. van Velzen, Huub C. J. Hoefsloot, Age K. Smilde. Discriminant Q-squared for
improved discrimination in PLSDA models. Metabolomics 2008; 4: 293-296.
DOI: 10.1007/s11306-008-0126-2
Data Acknowledgment
The test dataset provided at pyopls/tests/colorectal_cancer_nmr.csv is
available at the NIH Common Fund's National Metabolomics Data Repository
(NMDR) website, the Metabolomics Workbench,
[https://metabolomicsworkbench.org] where it has been assigned Project
ID PR000227. The data can be accessed directly via it's Project DOI
10.21228/M89P43. This work is
supported by NIH grant, U2C-DK119886.
Note: The test dataset consists only of those spectra belonging to
samples labeled "Colorectal Cancer" or "Healthy Control". The "target"
variable has the value -1 for samples labeled "Healthy Control" and
value +1 for samples labeled "Colorectal Cancer".
Contributors
Showing top 1 contributor by commit count.

Related Repositories

barahona-research-group/RamanSPy
RamanSPy: An open-source Python package for integrative Raman spectroscopy data analysis

cthoyt/chembl-downloader
Write reproducible code for getting and processing ChEMBL

olivertomic/hoggorm
Explorative multivariate statistics in Python

paucablop/chemotools
The scikit-learn-native foundation package for chemometrics 🧪 🤖

ALebrun-108/BoxSERS
Python package that provides a full range of functionality to process and analyze vibrational spectra (Raman, SERS, FTIR, etc.).

chemplexity/chromatography
functions for chromatography and mass spectrometry data analysis