Grademark
An API for backtesting trading strategies in JavaScript and TypeScript.
Toolkit for algo trading and backtesting in JavaScript and TypeScript. The project is written primarily in TypeScript, distributed under the MIT License license, first published in 2018. Key topics include: algorithmic-trading, backtesting, backtesting-trading-strategies, data-forge, drawdown.
Grademark
Toolkit for algo trading and backtesting in JavaScript and TypeScript.
This API builds on Data-Forge and is best used from Data-Forge Notebook (making it easy to plot charts and visualize).
Check out the release notes to see updates and breaking changes.
Please see what this looks like in the Grademark first example and the unit tests in this repo.
Love this? Please star this repo!
First example
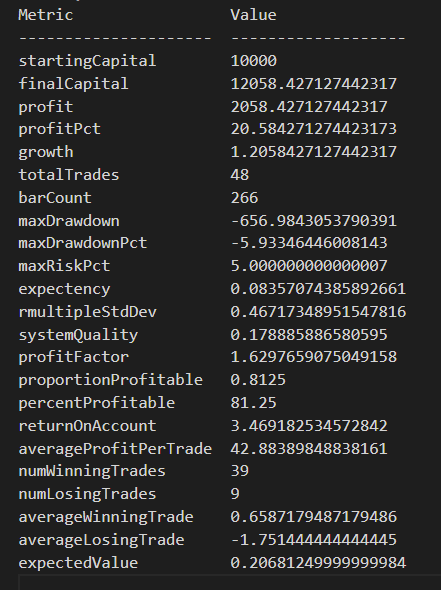
From the Grademark first example here's some example output. Click to see the first example as a notebook.
Analysis of a sequence of trades looks like this:
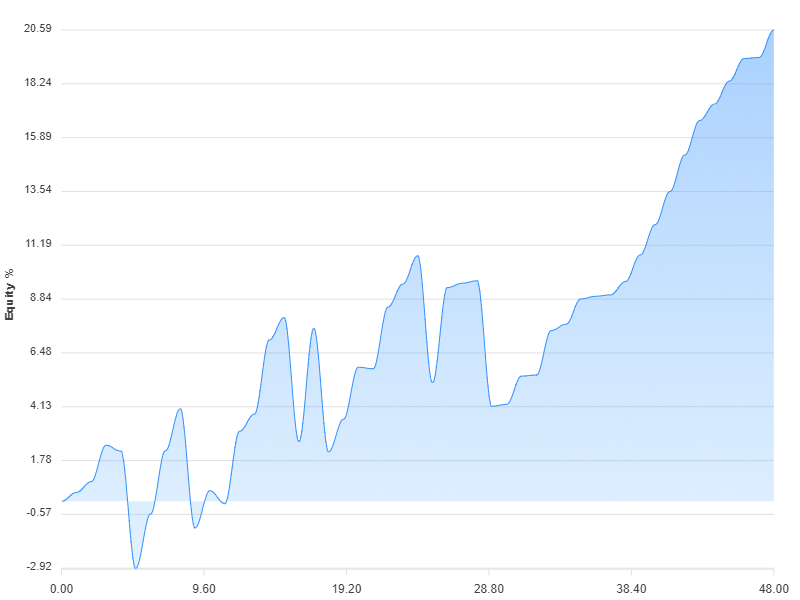
Here's a chart that visualizes the equity curve for the example strategy:
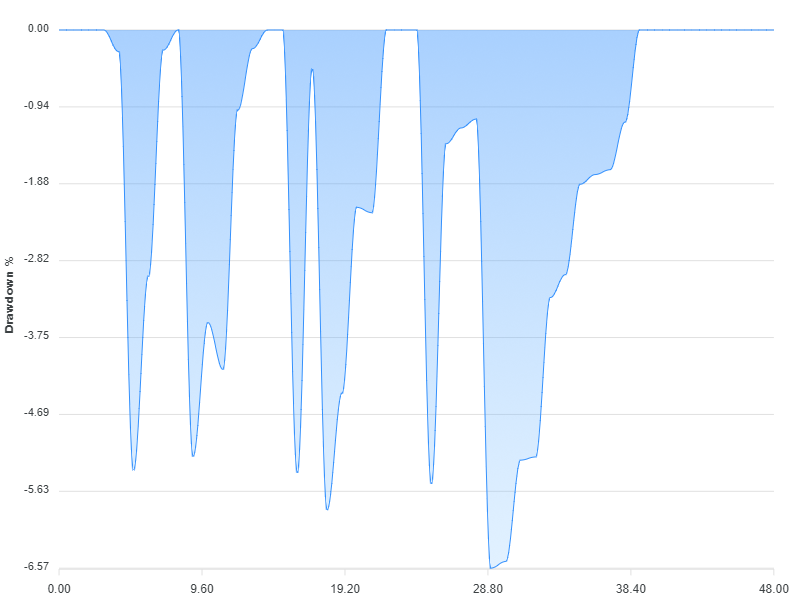
Here's another chart, this one is a visualization of the drawdown for the example strategy:
Pre-requisites
- Make sure your data is sorted in forward chronological order.
Data format
Your data needs to be loaded into memory in the following format:
typescriptinterface IBar { time: Date; open: number; high: number; low: number; close: number; } const data: IBar[] = ... load your data ...
Features
- Define a trading strategy with entry and exit rules.
- Backtest a trading strategy on a single financial instrument.
- Apply custom indicators to your input data series.
- Specify lookback period.
- Built-in intrabar stop loss.
- Compute and plot equity curve and drawdown charts.
- Throughly covered by automated tests.
- Calculation of risk and rmultiples.
- Intrabar profit target.
- Intrabar trailing stop loss.
- Conditional buy on price level (intrabar).
- Monte carlo simulation.
- Multiple parameter optimization based on permutations of parameters (using grid search and hill-climb algorithms).
- Walk forward optimization and backtesting.
- Plot a chart of trailing stop loss.
- Short selling.
Data-Forge Notebook comes with example JavaScript notebooks that demonstrate many of these features.
If you need help with new features please reach out!
Maybe coming later
- Support for precise decimal numbers.
- Fees.
- Slippage.
- Position sizing.
- Testing multiple instruments / portfolio simulation / ranking instruments.
- Market filters.
Complete examples
For a ready to go example please see the repo grademark-first-example.
Usage
Instructions here are for JavaScript, but this library is written in TypeScript and so it can also be used from TypeScript.
Installation
npm install --save grademark
Import modules
javascriptconst dataForge = require('data-forge'); require('data-forge-fs'); // For file loading capability. require('data-forge-indicators'); // For the moving average indicator. require('data-forge-plot'); // For rendering charts. const { backtest, analyze, computeEquityCurve, computeDrawdown } = require('grademark');
Load your data
Use Data-Forge to load and prep your data, make sure your data is sorted in forward chronological order.
This example loads a CSV file, but feel free to load your data from REST API, database or wherever you want!
javascriptlet inputSeries = dataForge.readFileSync("STW.csv") .parseCSV() .parseDates("date", "D/MM/YYYY") .parseFloats(["open", "high", "low", "close", "volume"]) .setIndex("date") // Index so we can later merge on date. .renameSeries({ date: "time" });
The example data file is available in the example repo.
Add indicators
Add whatever indicators and signals you want to your data.
javascriptconst movingAverage = inputSeries .deflate(bar => bar.close) // Extract closing price series. .sma(30); // 30 day moving average. inputSeries = inputSeries .withSeries("sma", movingAverage) // Integrate moving average into data, indexed on date. .skip(30) // Skip blank sma entries.
Create a strategy
This is a very simple and very naive mean reversion strategy:
javascriptconst strategy = { entryRule: (enterPosition, args) => { if (args.bar.close < args.bar.sma) { // Buy when price is below average. enterPosition({ direction: "long" }); // Long is default, pass in "short" to short sell. } }, exitRule: (exitPosition, args) => { if (args.bar.close > args.bar.sma) { exitPosition(); // Sell when price is above average. } }, stopLoss: args => { // Optional intrabar stop loss. return args.entryPrice * (5/100); // Stop out on 5% loss from entry price. }, };
Running a backtest
Backtest your strategy, then compute and print metrics:
javascriptconst trades = backtest(strategy, inputSeries) console.log("Made " + trades.length + " trades!"); const startingCapital = 10000; const analysis = analyze(startingCapital, trades); console.log(analysis);
Visualizing the results
Use Data-Forge Plot to visualize the equity curve and drawdown chart from your trading strategy:
javascriptcomputeEquityCurve(trades) .plot() .renderImage("output/my-equity-curve.png"); computeDrawdown(trades) .plot() .renderImage("output/my-drawdown.png");
Advanced backtesting
We are only just getting started in this example to learn more please follow my blog and YouTube channel.
Resources
Support the developer
<a target="_blank" href="https://www.codecapers.com.au/about#support-my-work">Click here to support the developer.</a>
Contributors
Showing top 2 contributors by commit count.


Related Repositories

freqtrade/freqtrade
Free, open source crypto trading bot

microsoft/qlib
Qlib is an AI-oriented Quant investment platform that aims to use AI tech to empower Quant Research, from exploring ideas to implementing productions. Qlib supports diverse ML modeling paradigms, including supervised learning, market dynamics modeling, and RL, and is now equipped with https://github.com/microsoft/RD-Agent to automate R&D process.

Fincept-Corporation/FinceptTerminal
FinceptTerminal is a modern finance application offering advanced market analytics, investment research, and economic data tools, designed for interactive exploration and data-driven decision-making in a user-friendly environment.

quantopian/zipline
Zipline, a Pythonic Algorithmic Trading Library

bbfamily/abu
阿布量化交易系统(股票,期权,期货,比特币,机器学习) 基于python的开源量化交易,量化投资架构

AI4Finance-Foundation/FinRL
FinRL®: Financial Reinforcement Learning. 🔥