DriverBuddyReloaded
Driver Buddy Reloaded is an IDA Pro Python plugin that helps automate some tedious Windows Kernel Drivers reverse engineering tasks
- [Driver Buddy Reloaded Quickstart](#driver-buddy-reloaded-quickstart) - [Table of Contents](#table-of-contents) - [Installation](#installation) - [Quick Usage](#quick-usage) - [Advanced Usage](#advanced-usage) - [About Driver Buddy Reloaded](#about-driver-buddy-reloaded) - [Finding DispatchDeviceControl](#finding-dispatchdevicecontrol) - [Labelling WDM and WDF Structures](#labelling-wdm-and-wdf-structures) - [Finding and Decoding IOCTL Codes](#finding-and-decoding-ioctl-codes) - [Flagging Func... The project is written primarily in Python, distributed under the GNU General Public License v3.0 license, first published in 2021. Key topics include: driver-exploitation, ida, ida-plugin, idapython, reverse-engineering.
Driver Buddy Reloaded Quickstart
![]()
Table of Contents
- Driver Buddy Reloaded Quickstart
Installation
Copy the DriverBuddyReloaded folder and the DriverBuddyReloaded.py script file into the IDA plugins folder, for example:
%APPDATA%\Hex-Rays\IDA Pro\plugins\C:\Program Files\IDA Pro 8.4\plugins\~/.idapro/plugins/
If your IDA is configured for Python 2, run the idapyswitch binary (located in IDA's folder) to switch it to Python 3.
NOTE: Driver Buddy Reloaded runs on IDA 7.x, 8.x (including 8.4) and 9.0+ with Python 3. All version-specific
IDA API differences (the removal of get_inf_structure, the ida_struct module and the idc.*struc* helpers in
IDA 9.0, etc.) are handled internally by the DriverBuddyReloaded/ida_compat.py compatibility layer.
Quick Usage
To use the auto-analysis feature:
- Start IDA and load a Windows kernel driver.
- Go to
Edit -> Plugins -> Driver Buddy Reloadedor pressCTRL+ALT+Ato start the auto-analysis. - Check the "Output" window for the analysis results, and the Driver Buddy Reloaded - Findings window that opens
at the end of the run (double-click a row to jump to its address). - The following files are written under IDA's DB directory (all prefixed with
<DRIVER_NAME>-YYYY-MM-DD-TIMESTAMP-):autoanalysis.txt- the full text analysis logfindings.json- machine-readable findings (IOCTLs, flagged functions, device names, pooltags, call chains)report.html- a standalone, severity-grouped HTML reportioctl_pocs.c- aDeviceIoControlPoC harness skeleton (severity-sorted)pooltags.txt- dumped Pooltags inpooltags.txtformat for WinDbg
To decode an IOCTL:
- Place the mouse cursor on the line containing a suspected IOCTL code.
- Right-click and select
Driver Buddy Reloaded -> Decode IOCTL; alternatively, press theCTRL+ALT+Dshortcut.
To decode ALL IOCTLs within a function:
- Place the mouse cursor on the first instruction of the function you believe to be the IOCTL dispatcher (
DispatchDeviceControl,DispatchInternalDeviceControl,Possible_DispatchDeviceControl_#) - Right-click and select
Driver Buddy Reloaded -> Decode ALL IOCTLs in Function; alternatively, press theCTRL+ALT+F
shortcut. - A
DriverName.sys-DATE-TIME_STAMP-IOCTLs.txtfile,
containing all the decoded IOCTLs up to that moment, will be written under IDA's DB directory.
To reopen the IOCTLs window or findings window at any time (without re-running analysis):
- Press
CTRL+ALT+Ito open the IOCTLs window. - Press
CTRL+ALT+Wto open the findings window.
Advanced Usage
-
The vulnerable_function_lists directory contains a lists of potentially
dangerous/problematic functions, Windows APIs and opcodes; a brief description on why a specific function/API has been listed is
provided. You can edit thecustomlist including driver's specific functions.Note:
winapi_function_prefixeswill partial match to start of function name (e.g.Zwwill matchZwClose,ZwCommitCompleteand so on) whilewinapi_functionswill perform exact matches only. -
In find_opcodes.py, the
find_opcode_dataoption will prevent Driver Buddy
Reloaded to find opcodes in data sections. Switching it toTruewill print something along
this line:
Found jnz short loc_15862 in sub_15820 at 0x00015852
Usually, going at the showed address and re-defining the selection as code will bring the searched opcode back.Watch out: switching it to
True, will generates more false positives!
About Driver Buddy Reloaded
Driver Buddy Reloaded is an IDA Pro Python plugin that helps automate some tedious Windows Kernel Drivers reverse
engineering tasks. It has a number of handy features, such as:
- Identifying the type of the driver (WDM, KMDF, UMDF, Mini-Filter, Stream Minidriver, AVStream, PortCls)
- Locating
DispatchDeviceControl/DispatchInternalDeviceControlfunctions - Populating common structures for
WDFandWDMdrivers- Attempts to identify and label structures like the
IRPandIO_STACK_LOCATION - Label calls to
WDFfunctions that would normally be unlabeled - Creates an
IRP_MJ_FUNCTIONIDA enum and applies it toMajorFunctionarray slots inDriverEntry(WDM)
- Attempts to identify and label structures like the
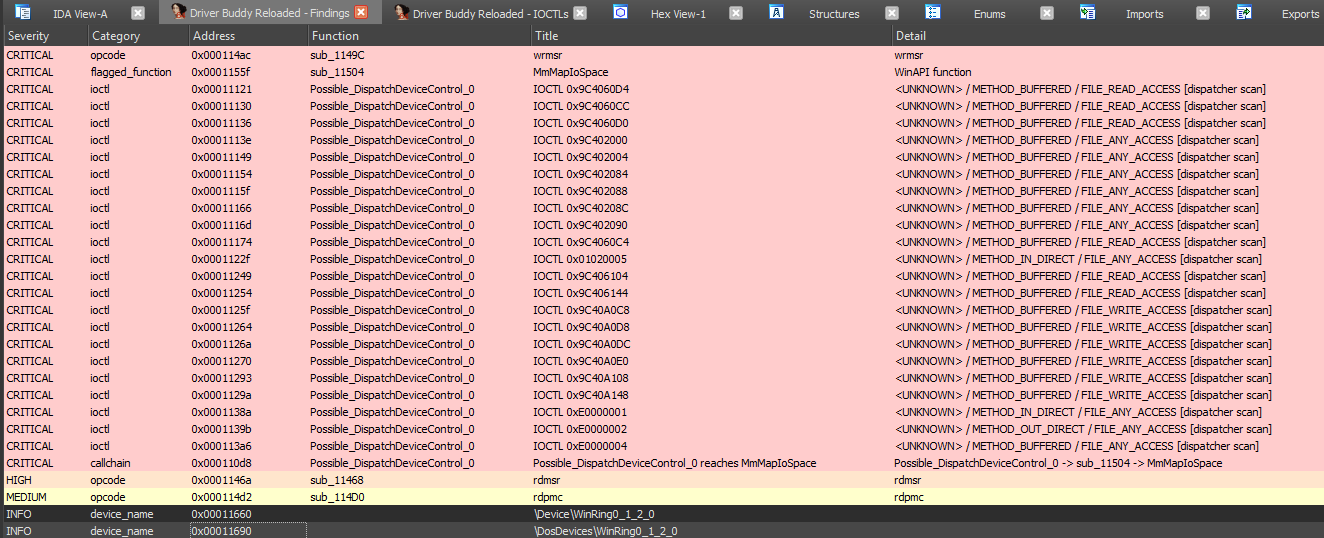
- Finding and decoding IOCTL codes
- Automatic flow-chart scan of identified dispatcher functions (no cursor placement required)
- NTSTATUS values resolved dynamically from the IDA type database (no static list)
- Flagging functions prone to misuse
- Finding potential
DeviceName(mmap scan + IDA Strings DB fallback, with source address) - Dumping
Pooltags(import-based primary + register-propagated fallback for tags staged in a register) - Heuristic vulnerability checks: unvalidated user-copy, missing privilege gate, IRQL mismatch, unsafe
MDL mapping, stack-allocated buffers (_alloca), pool allocation without size validation, and
\Device\PhysicalMemoryreferences (BYOVD pattern) - see Heuristic Vulnerability Checks - Exports audit: flags driver exports with zero internal cross-references (potential attack surface)
- Risk-scoring decoded IOCTLs (prioritising
METHOD_NEITHER/FILE_ANY_ACCESSand handlers that reach
dangerous sinks such asMmMapIoSpace,memcpy,__writemsr) and presenting all findings, by severity, in a
clickable results window (double-click to jump to the address) - Tracing call chains from dispatch / IOCTL handlers to dangerous sinks (heuristic, name-based)
- Exporting results as a machine-readable JSON file, a standalone HTML report, and a generated C/C++
DeviceIoControlPoC harness to bootstrap testing/fuzzing
Finding DispatchDeviceControl
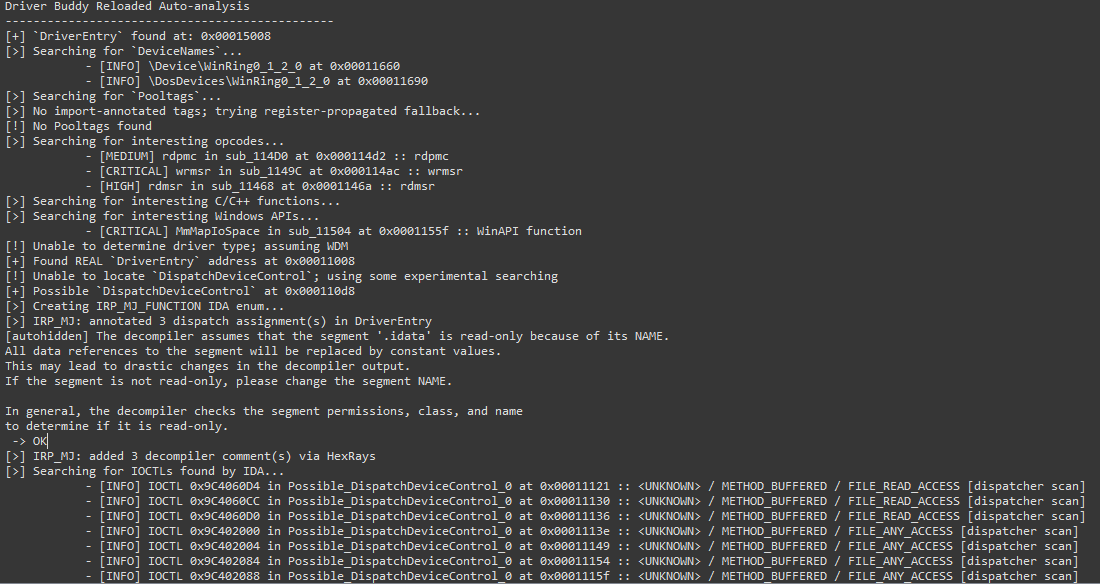
The tool can automatically locate and identify the DispatchDeviceControl routine. This function is used to route all
incoming DeviceIoControl codes to the specific driver function associated with that code. Automatically identifying
this function makes finding the valid DeviceIoControl codes for each driver much quicker. Additionally, when
investigating possible vulnerabilities in a driver due to a crash, knowing the location of this function helps narrow
the focus to the specific function call associated with the crashing DeviceIoControl code.
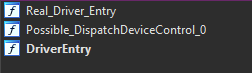
When the analysis is successful some subs will be renamed as follow:
DriverEntry: the original first driver-supplied routine that is called after a driver is loaded. It is responsible
for initializing the driver.Real_Driver_Entry: usually the function where the execution fromDriverEntryhas been transferred to. It is
usually where theDeviceNameis initialized.DispatchDeviceControl/DispatchInternalDeviceControl: if the tool was able to recover the functions at some
specific offsets, the functions will then be renamed with the appropriate name.Possible_DispatchDeviceControl_#: if the tool was not able to recoverDispatchDeviceControl
orDispatchInternalDeviceControl, it employs an experimental searching, following the execution flow, and checking
for cases where the function is loading knownIO_STACK_LOCATION&IRPaddresses; indicating that the function
could be the DispatchDeviceControl. As it is based on heuristic, it could return more than one result, and it is prone
to false positives.
Labelling WDM and WDF Structures
Several driver structures are shared among all WDM/WDF drivers. The tool is able to automatically identify these
structures, such as the IO_STACK_LOCATION, IRP, and DeviceObject structures and can help save time during the
reverse engineering process and provide context to areas of the driver where these functions are in use.

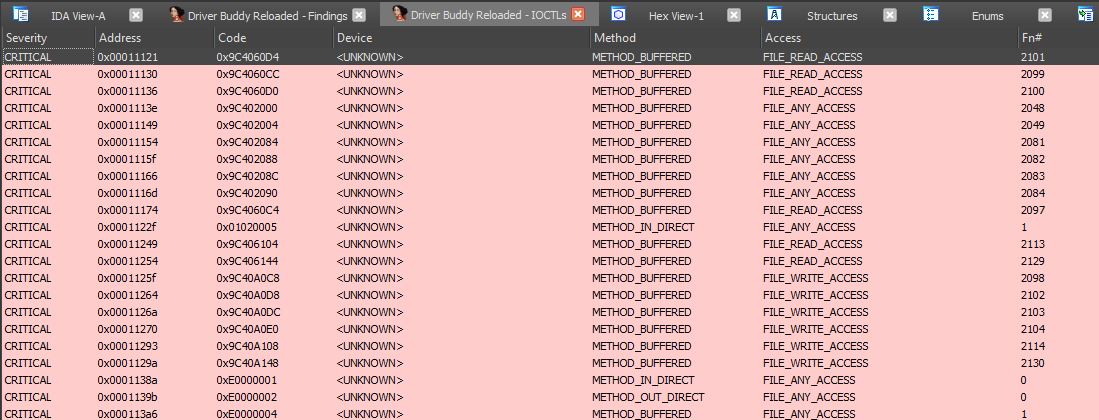
Finding and Decoding IOCTL Codes
While reversing drivers, it is common to come across IOCTL codes as part of the analysis. These codes, when decoded,
reveal useful information and may draw focus to specific parts of the driver where vulnerabilities are more likely to
exist.
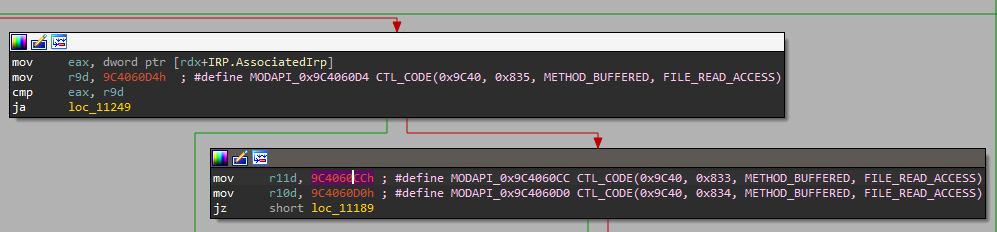
By right-clicking on a potential IOCTL code, a context menu option is presented (alternatively using the
Ctrl+Alt+D shortcut when the cursor is on the line containing a suspected IOCTL code) and can be used to decode the
value. This will print out a table with all decoded IOCTL codes. By right-clicking on a decoded IOCTL code, in the
disassembly view, it's possible to mark it as invalid; this will leave any non-IOCTL comment intact.
If you right-click, alternatively using the
Ctrl+Alt+F shortcut, on the first instruction of the function you believe to be the IOCTL dispatcher (
DispatchDeviceControl, DispatchInternalDeviceControl, Possible_DispatchDeviceControl_#) under the Driver Buddy
Reloaded menu, a "Decode All" option appears, this attempt to decode all the IOCTL codes it can find in the
function. This is a bit hacky but most of the time it can speed things up.
- An
IOCTLs.txtfile (prefixed with<DRIVER_NAME>-YYYY-MM-DD-TIMESTAMP-) containing all decoded IOCTLs is
written under IDA's DB directory.
Auto-analysis additionally runs a flow-chart scan over identified dispatcher functions to discover IOCTLs
automatically, without requiring manual cursor placement.
Flagging Functions
Driver Buddy Reloaded has lists of C/C++ functions, opcodes and Windows APIs (defined in
the vulnerable_function_lists directory) that are commonly vulnerable
or that can facilitate buffer overflow conditions. All found instances are reported back during the auto-analysis and
can help while looking for possible user-controlled code paths reaching sensitive functions.
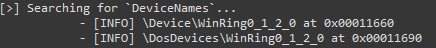
Finding DeviceName
The tool automatically attempts to find the drivers registered device paths (DeviceName), if no paths can be found by
looking at Unicode strings inside the binary, then the analyst can manually try to use
Madiant's FLOSS in an attempt to find obfuscated paths.
Dumping Pooltags
During the auto-analysis, the tool also dumps the Pooltags used by the binary in a format that works
with pooltags.txt. The output can then be copy-pasted at the end of the file and later picked up by WinDbg.
- A
DriverName.sys-DATE-TIME_STAMP-pooltags.txtfile, containing all the dumped Pooltags, will be written under
IDA's DB directory.

Heuristic Vulnerability Checks
The heuristics.py module runs after call-chain tracing and examines each identified dispatch handler function.
It emits findings in the heuristic category:
| Check | What is flagged | Severity |
|---|---|---|
| Unvalidated user copy | memcpy/RtlCopyMemory/etc. with no nearby ProbeForRead/ProbeForWrite/safe-string guard | HIGH (handler), MEDIUM (other) |
| Missing privilege gate | ZwOpenProcess/ZwAllocateVirtualMemory/etc. with no SeSinglePrivilegeCheck/SeAccessCheck in the function | HIGH |
| IRQL mismatch | Pageable / Zw* / MmMap* call when an IRQL-raising function is also present | MEDIUM |
| Unsafe MDL mapping | MmMapLockedPages/MmProbeAndLockPages/etc. with UserMode in disassembly | HIGH, else MEDIUM |
| Stack allocation | _alloca/_malloca/_chkstk call (large or dynamic stack allocation) | LOW |
| Pool alloc without size validation | ExAllocatePool* call with no safe-arithmetic guard nearby (integer-overflow-before-alloc pattern) | HIGH |
\Device\PhysicalMemory reference | Cross-reference to the physical memory device object string (BYOVD pattern via ZwOpenSection/ZwMapViewOfSection) | HIGH (handler), MEDIUM (other) |
These are lead generators, not confirmed vulnerabilities. Treat HIGH/CRITICAL findings as starting points for
manual review.
Feature Flags
All optional analysis stages are controlled by DriverBuddyReloaded/config.py. Edit the Feature class to
enable or disable them:
| Flag | Default | Description |
|---|---|---|
HEURISTICS | True | Heuristic vulnerability checks (copy validation, privilege gate, IRQL, MDL, alloca) |
EXPORTS_AUDIT | True | Flag driver exports with zero internal cross-references |
POOLTAG_FALLBACK | True | Register-propagated pool tag scanner (used when import-based scan finds nothing) |
IRP_MJ_ENUM | True | Create IRP_MJ_FUNCTION IDA enum and apply to MajorFunction slots (WDM only) |
CALLCHAIN | True | BFS call-chain tracing from handlers to dangerous sinks |
RISK_SCORING | True | IOCTL risk scoring (METHOD/ACCESS weights + sink bump) |
RESULTS_WINDOW | True | Show the Driver Buddy Reloaded findings window after analysis |
JSON_EXPORT | True | Write findings.json |
HTML_REPORT | True | Write report.html |
POC_HARNESS | True | Write ioctl_pocs.c PoC harness |
SEGMENT_OPCODE_SCAN | False | Linear segment-wide opcode scan (noisy, off by default) |
Known Caveats and Limitations
- IOCTL candidates are validated against the
CTL_CODEstructure: the DeviceType field (bits 31-16) must be non-zero, and the value must not match a known NTSTATUS code. This rules out loop counters and small immediates while preserving all valid IOCTLs including vendor-defined device types (0x8000+). The filter is applied by both theIoControlCodexref scan and the dispatcher flow-chart scan. Issue #15 - Risk scoring and call-chain tracing are heuristic, name-based lead generators, not dataflow analysis; treat
High/Critical findings as places to look first, not as confirmed vulnerabilities. Feature toggles live in
DriverBuddyReloaded/config.py. - Experimental
DispatchDeviceControlsearching works only for x64 drivers - In find_opcodes.py, the
find_opcode_dataoption will prevent Driver Buddy
Reloaded to find opcodes in data sections. Switching it toTruewill print something along
this line:
Found jnz short loc_15862 in sub_15820 at 0x00015852
Usually, going at the showed address and re-defining the selection as code will bring the searched opcode back.
Watch out: It is prone to false positives!
Credits and Acknowledgements
- Created in 2021 by Paolo Stagno aka @Void_Sec:
- Risk-scoring, reporting and PoC-generation ideas adapted from
Driver Buddy Revolutions by Juan Sacco. - DriverBuddy was originally written by Braden Hollembaek and Adam Pond of
NCC Group. - Using Satoshi Tanda's IOCTL decoder.
- The WDF functions struct is based on Red Plait's work and
was ported to IDA Python by Nicolas Guigo, later updated by Braden Hollembaek and Adam Pond. - Using Sam Brown's F-Secure win_driver_plugin to retrieve device
name and pool tags, specifically Alexander Pick fork. - The original code for adding items to the right-click menu (and possibly some other random snippets) came
from 'herrcore'. - Proudly developed using PyCharm for Open Source development by JetBrains
Contributors
Showing top 7 contributors by commit count.