Code debug
Native debugging for VSCode
**code debug** is a Native debugging for VSCode The project is written primarily in TypeScript, distributed under the The Unlicense license, first published in 2016. Key topics include: debugger, extension, gdb, gdb-server, lldb.
Debug


Native VSCode debugger. Supports both GDB and LLDB.
Installation
Press ctrl-p (cmd+p on OS X) and run ext install webfreak.debug in visual studio code and install GDB/LLDB. See Usage for details on how to set it up.
Usage
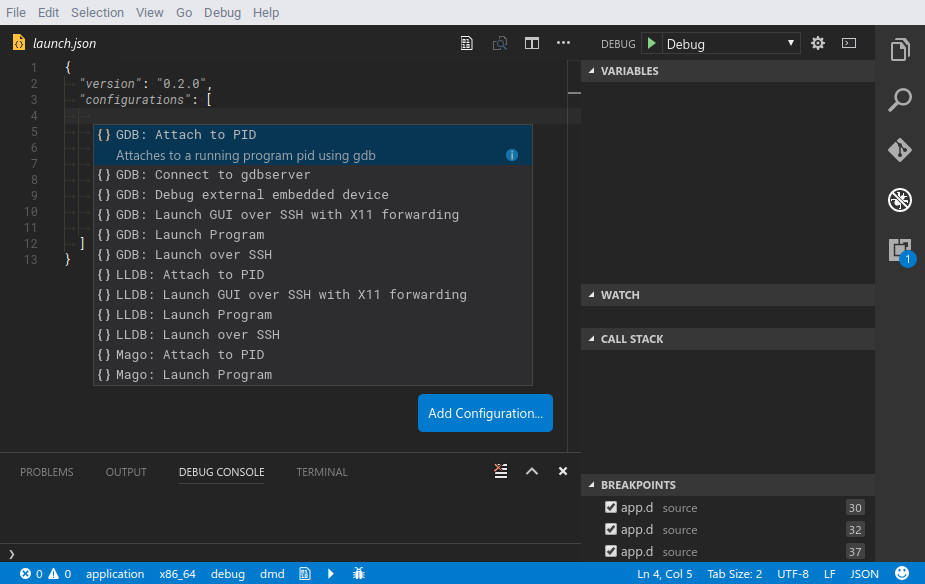
Or if you already have an existing debugger in your project setup you can click "Create Configuration" or use the auto completion instead:
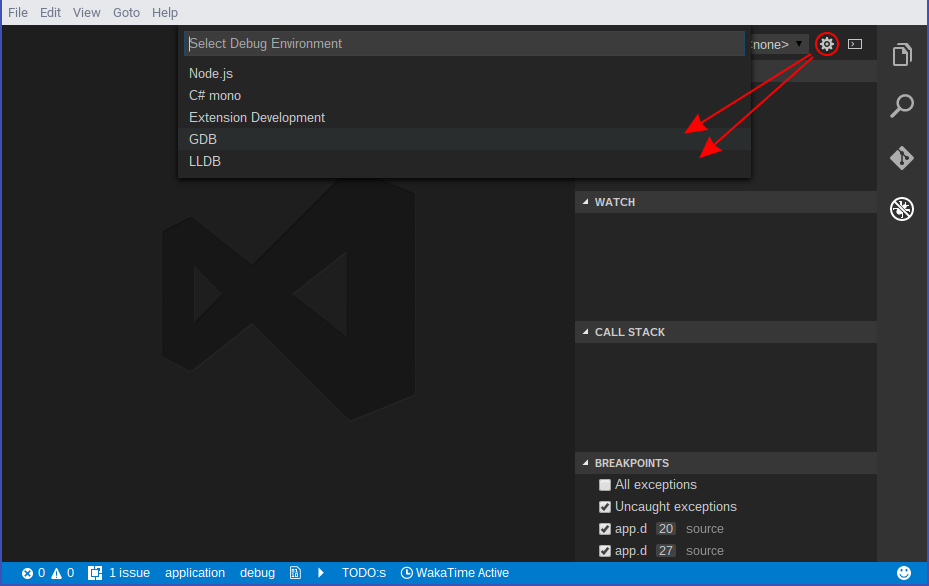
Open your project and click the debug button in your sidebar. At the top right press
the little gear icon and select GDB or LLDB. It will automatically generate the configuration
you need.
Note: for LLDB you need to have lldb-mi in your PATH
If you are on OS X you can add lldb-mi to your path using
ln -s /Applications/Xcode.app/Contents/Developer/usr/bin/lldb-mi /usr/local/bin/lldb-mi if you have Xcode.
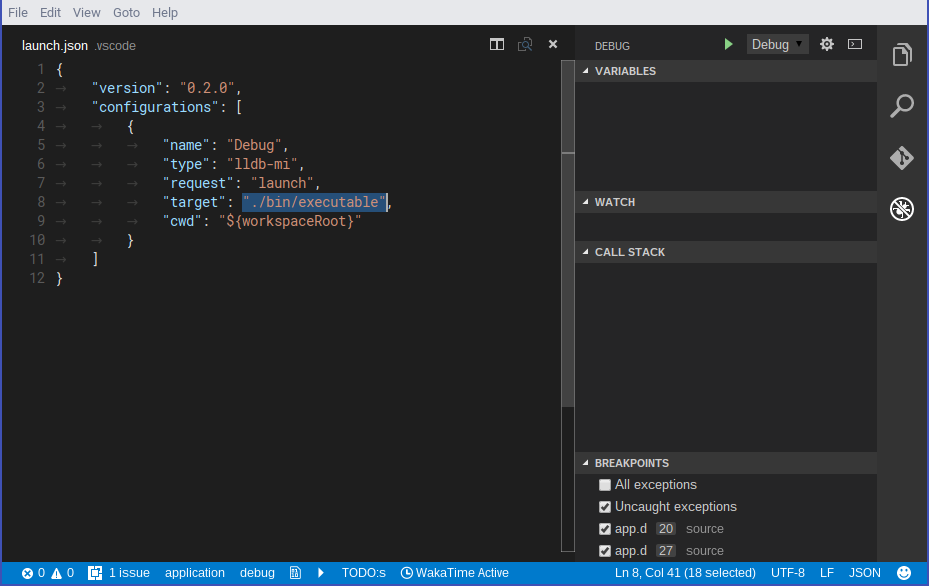
Now you need to change target to the application you want to debug relative
to the cwd. (Which is the workspace root by default)
Additionally you can set terminal if you want to run the program in a separate terminal with
support for input. On Windows set it to an empty string ("") to enable this feature. On linux
set it to an empty string ("") to use the default terminal emulator specified with x-terminal-emulator
or specify a custom one. Note that it must support the -e argument.
Before debugging you need to compile your application first, then you can run it using
the green start button in the debug sidebar. For this you could use the preLaunchTask
argument vscode allows you to do. Adding breakpoints while the program runs will not
interrupt it immediately. For that you need to pause & resume the program once first.
However adding breakpoints while its paused works as expected.
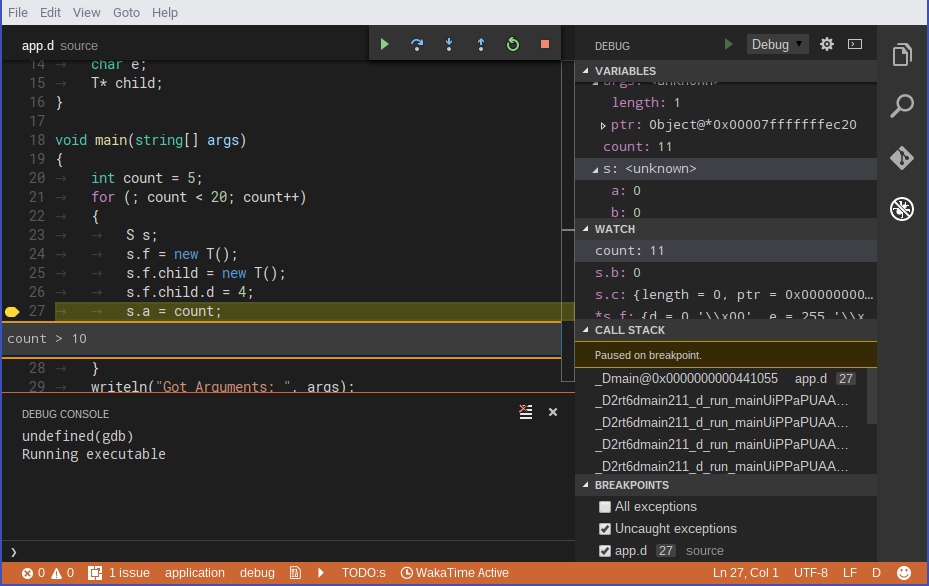
Extending variables is very limited as it does not support child values of variables.
Watching expressions works partially but the result does not get properly parsed and
it shows the raw output of the command. It will run data-evaluate-expression
to check for variables.
While running you will get a console where you can manually type GDB/LLDB commands or MI
commands prepended with a hyphen -. The console shows all output separated
in stdout for the application, stderr for errors and log for log messages.
Some exceptions/signals like segmentation faults will be caught and displayed but
it does not support for example most D exceptions.
Support exists for stopping at the entry point of the application. This is controlled
through the stopAtEntry setting. This value may be either a boolean or a string. In
the case of a boolean value of false (the default), this setting is disabled. In the
case of a boolean value of true, if this is a launch configuration and the debugger
supports the start (or exec-run --start MI feature, more specifically), than this
will be used to run to the entry point of the application. Note that this appears to
work fine for GDB, but LLDB doesn't necessarily seem to adhere to this, even though it may
indicate that it supports this feature. The alternative configuration option for the
stopAtEntry setting is to specify a string where the string represents the entry point
itself. In this situation a temporary breakpoint will be set at the specified entry point
and a normal run will occur for a launch configuration. This (setting a temporary
breakpoint) is also the behavior that occurs when the debugger does not support the
start feature and the stopAtEntry was set to true. In that case the entry point will
default to "main". Thus, the most portable way to use this configuration is to explicitly
specify the entry point of the application. In the case of an attach configuration, similar
behavior will occur, however since there is no equivalent of the start command for
attaching, a boolean value of true for the stopAtEntry setting in a launch configuration
will automatically default to an entry point of "main", while a string value for this
setting will be interpreted as the entry point, causing a temporary breakpoint to be set at
that location prior to continuing execution. Note that stopping at the entry point for the
attach configuration assumes that the entry point has not yet been entered at the time of
attach, otherwise this will have no affect.
There is a Registers view in the VARIABLES view. As we fetch all registers at once, there can
be cases where a register that cannot be fetched causes the entire register request to fail,
corrupting the entire Registers output. If this happens, you might need to set the
registerLimit option to specify which registers you want the debugger to fetch
automatically.
For example, to display only registers rax and rip in an x64 debug session, send the
command -data-list-register-names in the debug console of an active x64 debug session.
You will then receive a response containing an array starting with ["rax","rbx" ...].
In this array, the index of rax is 0 and rip is 16, so set the option as
"registerLimit": "0 16". If you find the response text hard to navigate, you can paste
it into a browser's developer tools console and press enter to get an expandable response
object with array elements' indices explicitly displayed.
Attaching to existing processes
Attaching to existing processes currently only works by specifying the PID in the
launch.json and setting request to "attach". You also need to specify the executable
path for the debugger to find the debug symbols.
"request": "attach",
"executable": "./bin/executable",
"target": "4285"
This will attach to PID 4285 which should already run. GDB will pause the program on entering and LLDB will keep it running.
Using gdbserver for remote debugging (GDB only)
You can also connect to a gdbserver instance and debug using that. For that modify the
launch.json by setting request to "attach" and remote to true and specifying the
port and optionally hostname in target.
"request": "attach",
"executable": "./bin/executable",
"target": ":2345",
"cwd": "${workspaceRoot}",
"remote": true
This will attach to the running process managed by gdbserver on localhost:2345. You might
need to hit the start button in the debug bar at the top first to start the program.
Control over whether the debugger should continue executing on connect can be configured
by setting stopAtConnect. The default value is false so that execution will continue
after connecting.
Using ssh for debugging on remote
Debugging using ssh automatically converts all paths between client & server and also optionally
redirects X11 output from the server to the client.
Simply add a ssh object in your launch request.
"request": "launch",
"target": "./executable",
"cwd": "${workspaceRoot}",
"ssh": {
	"forwardX11": true,
	"host": "192.168.178.57",
	"cwd": "/home/remoteUser/project/",
	"keyfile": "/path/to/.ssh/key", // OR
	"password": "password123",
	"user": "remoteUser",
	"x11host": "localhost",
	// x11port may also be specified as string containing only numbers (useful to use configuration variables)
	"x11port": 6000,
	// Optional, content will be executed on the SSH host before the debugger call.
	"bootstrap": "source /home/remoteUser/some-env"
}
ssh.sourceFileMap will be used to trim off local paths and map them to the server. This is
required for basically everything except watched variables or user commands to work.
For backward compatibility you can also use cwd and ssh.cwd for the mapping, this is only used
if the newer ssh.sourceFileMap is not configured.
For X11 forwarding to work you first need to enable it in your Display Manager and allow the
connections. To allow connections you can either add an entry for applications or run xhost +
in the console while you are debugging and turn it off again when you are done using xhost -.
Because some builds requires one or more environment files to be sourced before running any
command, you can use the ssh.bootstrap option to add some extra commands which will be prepended
to the debugger call (using && to join both).
Debugging a process from a different user (especially root/system processes)
To debug a program that needs additional privileges you may use one of the two approaches:
- start vscode with the necessary rights (so both the program and the started debugger instance will
have root rights) -sudo code/sudo codiumor "start as admin".
Note that this has a lot of security implications and will have the user settings of vscode for this user. - preferred: use a small wrapper script that calls
sudo gdb $*/runas /profile /user:admin-user
(or the debugger of your choice) and configure this extension to use it (for example withgdbpath)
Extra Debugger Arguments
Additional arguments can be supplied to the debugger if needed. These will be added when
the debugger executable (e.g., gdb, lldb-mi, etc.) is launched. Extra debugger arguments
are supplied via the debugger_args setting. Note that the behavior of escaping these
options depends on the environment in which the debugger is started. For non-SSH
debugging, the options are passed directly to the application and therefore no escaping is
necessary (other than what is necessary for the JSON configuration). However, as a result
of the options being passed directly to the application, care must be taken to place
switches and switch values as separate entities in debugger_args, if they would normally
be separated by a space. For example, supplying the option and value
-iex "set $foo = \"bar\"" would consist of the following debugger_args:
json"debugger_args" : ["-iex", "set $foo = \"bar\""]
If = is used to associate switches with their values, than the switch and value should
be placed together instead. In fact, the following example shows 4 different ways in
which to specify the same switch and value, using both short and long format, as well as
switch values supplied as a separate parameter or supplied via the =:
-
json
"debugger_args" : ["-iex", "set $foo = \"bar\""] -
json
"debugger_args" : ["-iex=set $foo = \"bar\""] -
json
"debugger_args" : ["--init-eval-command", "set $foo = \"bar\""] -
json
"debugger_args" : ["--init-eval-command=set $foo = \"bar\""]
Where escaping is really necessary is when running the debugger over SSH. In this case,
the options are not passed directly to the application, but are instead combined with the
application name, joined together with any other options, and sent to the remote system to
be parsed and executed. Thus, depending on the remote system, different escaping may be
necessary. The following shows how the same command as above needs to be escaped
differently based on whether the remote system is a POSIX or a Windows system.
- SSH to Linux machine:
json
"debugger_args": ["-iex", "'set $foo = \"bar\"'"] - SSH to Windows machine:
json
"debugger_args": ["-iex", "\"set $foo = \\\"bar\\\"\""]
You may need to experiment to find the correct escaping necessary for the command to be
sent to the debugger as you intended.
LogMessage
LogMessage will print a message in the debug console when breakpoint is hit. Expressions within {} are interpolated.
Issues
Contributors
Showing top 12 contributors by commit count.


Related Repositories

x64dbg/x64dbg
An open-source user mode debugger for Windows. Optimized for reverse engineering and malware analysis.

go-delve/delve
Delve is a debugger for the Go programming language.

liriliri/eruda
Console for mobile browsers

rizinorg/cutter
Free and Open Source Reverse Engineering Platform powered by rizin

cool-RR/PySnooper
Never use print for debugging again

winsiderss/systeminformer
A free, powerful, multi-purpose tool that helps you monitor system resources, debug software and detect malware. Brought to you by Winsider Seminars & Solutions, Inc. @ https://windows-internals.com