Technicalindicators
A javascript technical indicators written in typescript with pattern recognition right in the browser
**technicalindicators** is A javascript technical indicators written in typescript with pattern recognition right in the browser The project is written primarily in JavaScript, distributed under the MIT License license, first published in 2016. It has gained significant community traction with 2,437 stars and 579 forks on GitHub. Key topics include: candle-stick, candlestick-patterns-detection, cryptocurrency, head-and-shoulders, stock-data.

TechnicalIndicators
A javascript technical indicators written in typescript.
Installation
Node.js versions >= 10
bashnpm install --save technicalindicators
javascriptconst SMA = require('technicalindicators').SMA;
Node.js versions < 10
For nodejs version below 10 use 1.x versions of this library.
Webpack
Make sure you have the following in your config file.
javascriptmodule.exports = { resolve: { mainFields: ["module", "main"] } }
Browser
For browsers install using npm,
For ES6 browsers use
bashnpm install --save technicalindicators
html<script src="node_modules/technicalindicators/dist/browser.es6.js"></script>
For ES5 support it is necessary to include the babel-polyfill and respective file browser.js otherwise you will get an error. For example see index.html
bashnpm install --save technicalindicators npm install --save babel-polyfill
html<script src="node_modules/babel-polyfill/browser.js"></script> <script src="node_modules/technicalindicators/dist/browser.js"></script>
Pattern detection
Pattern detection is removed from version 3.0, if you need pattern detection use v2.0
All indicators will be available in window object. So you can just use
javascriptsma({period : 5, values : [1,2,3,4,5,6,7,8,9], reversedInput : true});
or
javascriptSMA.calculate({period : 5, values : [1,2,3,4,5,6,7,8,9]});
Playground
Playground with code completion
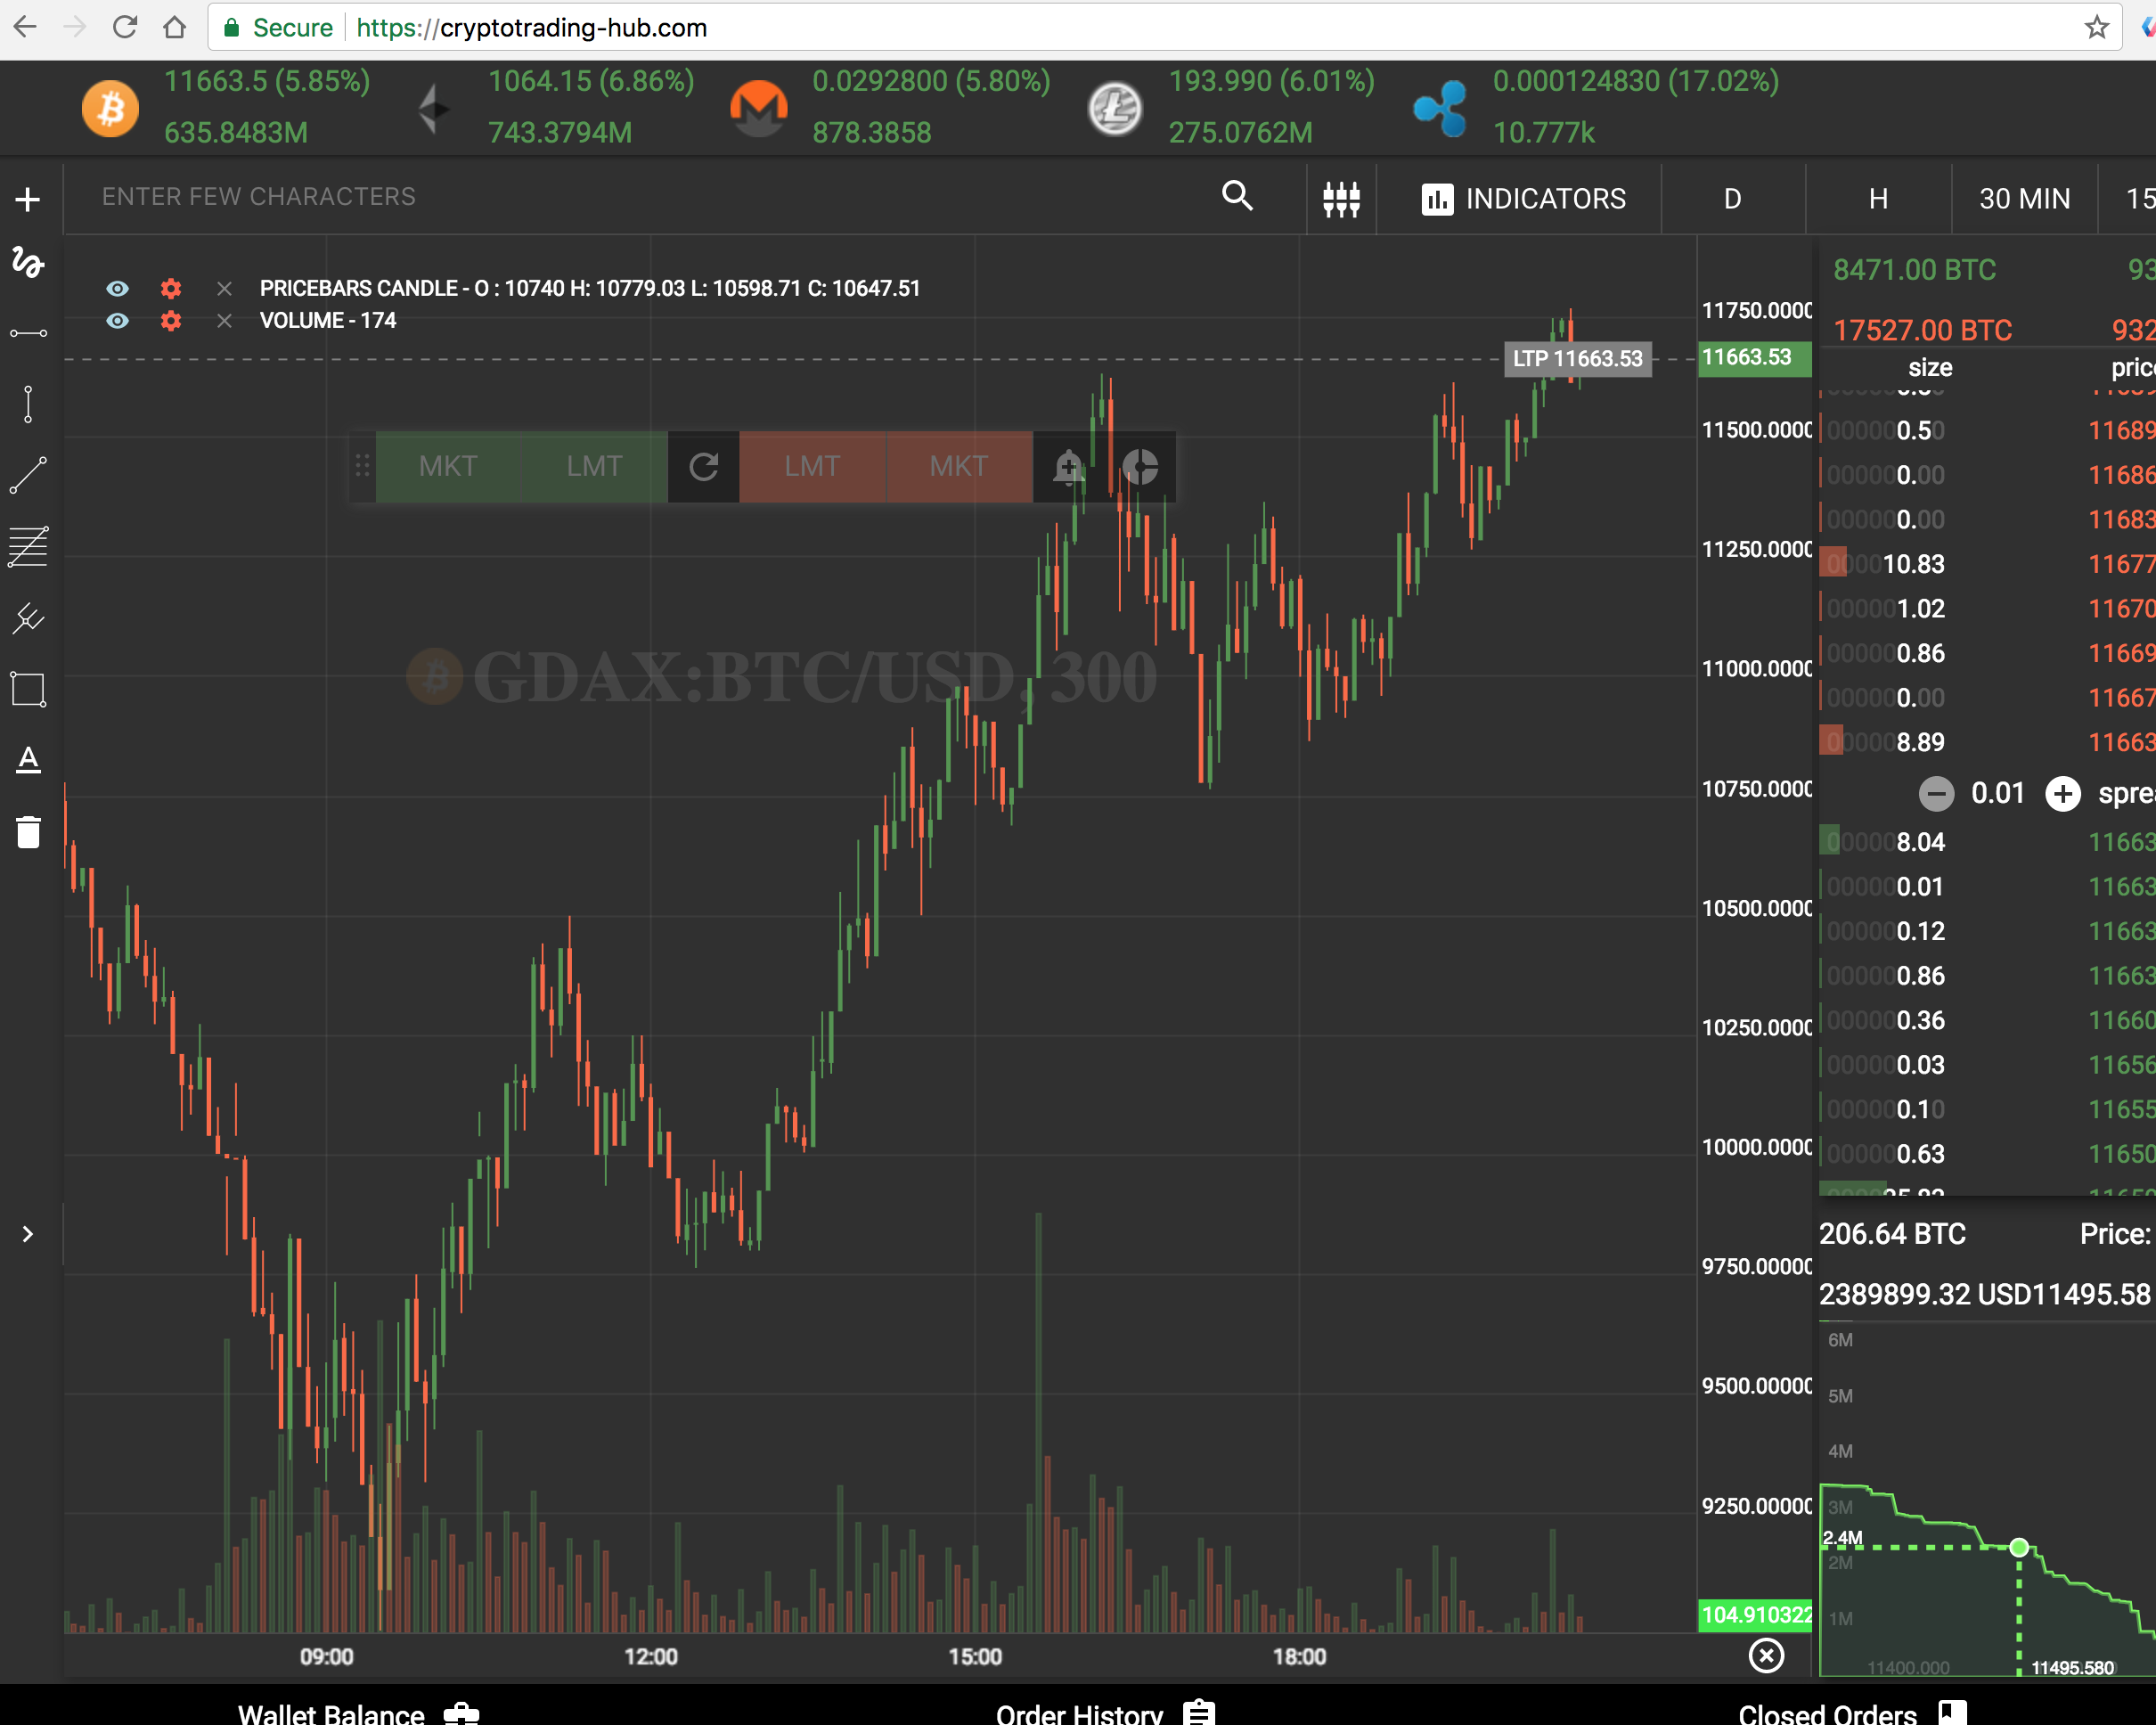
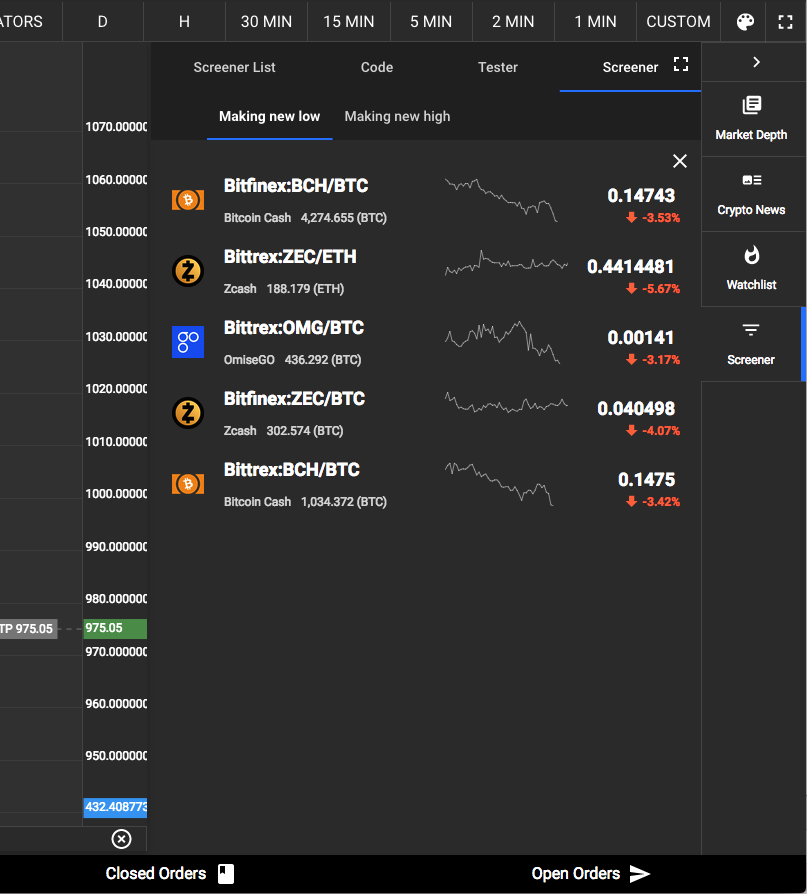
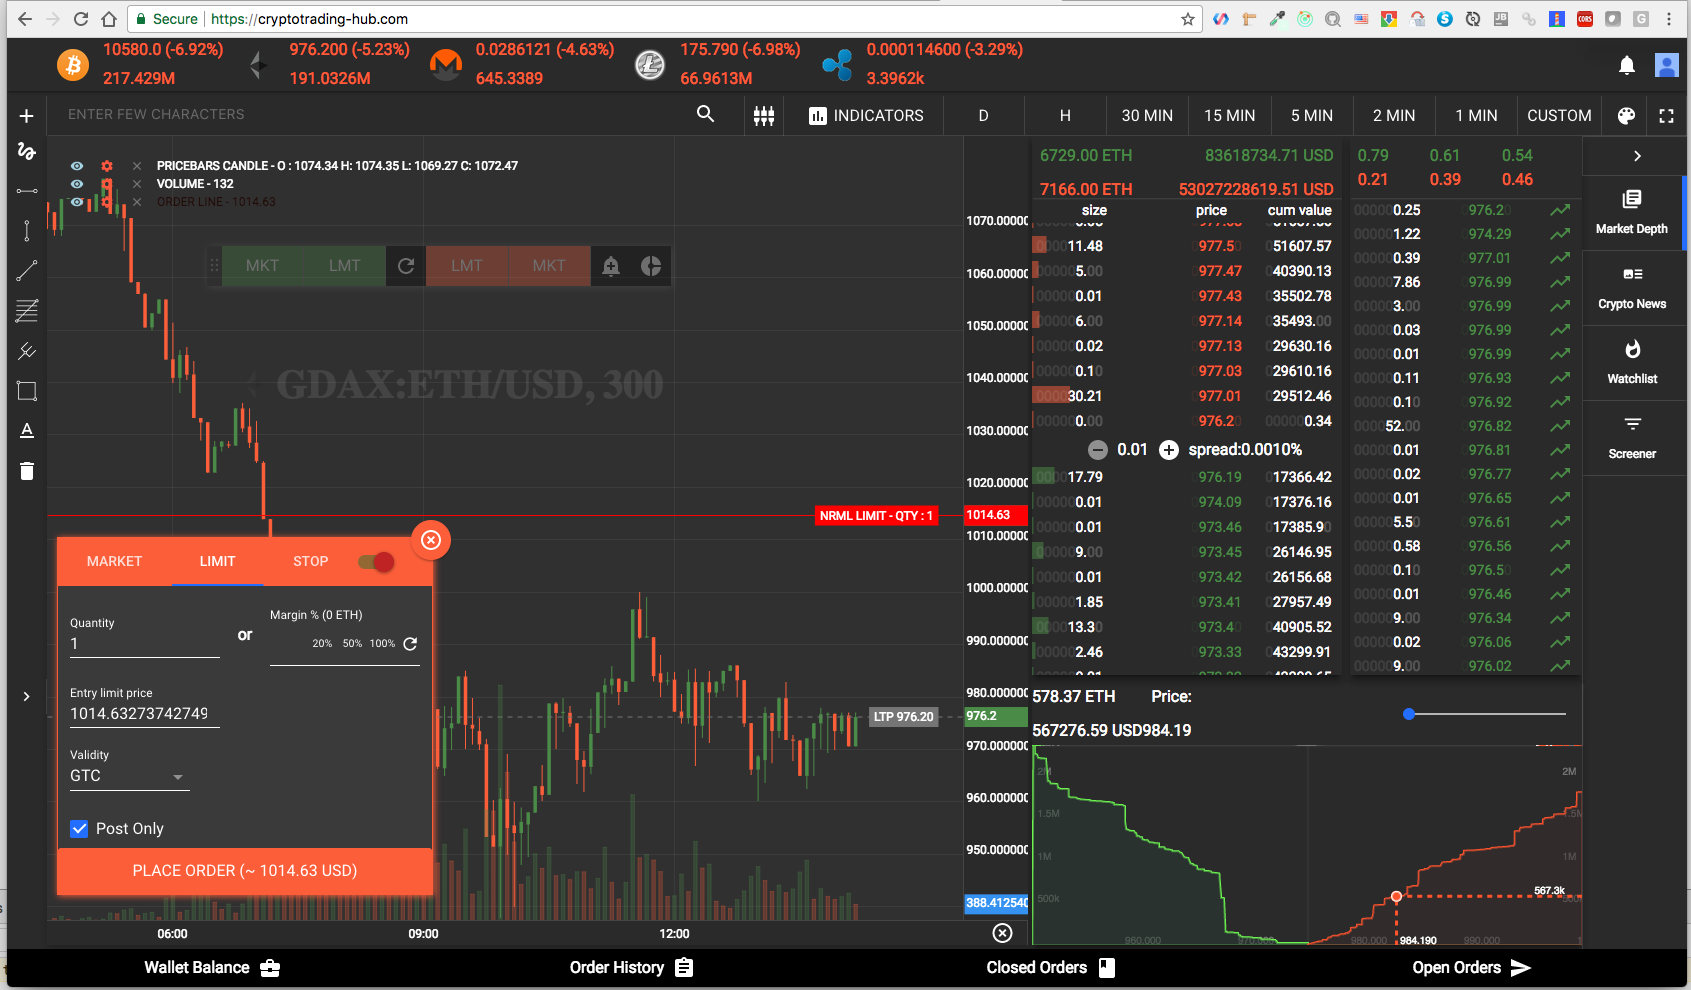
Crypto Trading hub
If you like this project. You'll love my other project crypto trading hub
- Its free
- Realtime price charts
- Unified trading experience across exchanges
- Price alerts
- Realtime crypto screening using javascript (Find coins making high and low in realtime or anything you can write using this library and javascript in realtime)
- Trading from charts,
- Modify orders and ability to trade and create studies using javascript.
Available Indicators
- Accumulation Distribution Line (ADL).
- Average Directional Index (ADX).
- Average True Range (ATR).
- Awesome Oscillator (AO).
- Bollinger Bands (BB).
- Commodity Channel Index (CCI).
- Force Index (FI).
- Know Sure Thing (KST).
- Moneyflow Index (MFI).
- Moving Average Convergence Divergence (MACD).
- On Balance Volume (OBV).
- Parabolic Stop and Reverse (PSAR).
- Rate of Change (ROC).
- Relative Strength Index (RSI).
- Simple Moving Average (SMA).
- Stochastic Oscillator (KD).
- Stochastic RSI (StochRSI).
- Triple Exponentially Smoothed Average (TRIX).
- Typical Price.
- Volume Weighted Average Price (VWAP).
- Volume Profile (VP).
- Exponential Moving Average (EMA).
- Weighted Moving Average (WMA).
- Wilder’s Smoothing (Smoothed Moving Average, WEMA).
- WilliamsR (W%R).
- Ichimoku Cloud.
Other Utils
Chart Types
CandleStick Pattern
- Abandoned Baby.
- Bearish Engulfing Pattern.
- Bullish Engulfiing Pattern.
- Dark Cloud Cover.
- Downside Tasuki Gap.
- Doji.
- DragonFly Doji.
- GraveStone Doji.
- BullishHarami.
- Bearish Harami Cross.
- Bullish Harami Cross.
- Bullish Marubozu.
- Bearish Marubozu.
- Evening Doji Star.
- Evening Star.
- Bearish Harami.
- Piercing Line.
- Bullish Spinning Top.
- Bearish Spinning Top.
- Morning Doji Star.
- Morning Star.
- Three Black Crows.
- Three White Soldiers.
- Bullish Hammer.
- Bearish Hammer.
- Bullish Inverted Hammer.
- Bearish Inverted Hammer.
- Hammer Pattern.
- Hammer Pattern (Unconfirmed).
- Hanging Man.
- Hanging Man (Unconfirmed).
- Shooting Star.
- Shooting Star (Unconfirmed).
- Tweezer Top.
- Tweezer Bottom.
or
Search for all bullish or bearish using
javascriptvar twoDayBullishInput = { open: [23.25,15.36], high: [25.10,30.87], close: [21.44,27.89], low: [20.82,14.93], } var bullish = require('technicalindicators').bullish; bullish(twoDayBullishInput) //true
API
There are three ways you can use to get the indicator results.
calculate
Every indicator has a static method calculate which can be used to calculate the indicator without creating an object.
javascriptconst sma = require('technicalindicators').sma; var prices = [1,2,3,4,5,6,7,8,9,10,12,13,15]; var period = 10; sma({period : period, values : prices})
or
javascriptconst SMA = require('technicalindicators').SMA; var prices = [1,2,3,4,5,6,7,8,9,10,12,13,15]; var period = 10; SMA.calculate({period : period, values : prices})
nextValue
nextValue method is used to get the next indicator value.
javascriptvar sma = new SMA({period : period, values : []}); var results = []; prices.forEach(price => { var result = sma.nextValue(price); if(result) results.push(result) });
getResult
This a merge of calculate and nextValue. The usual use case would be
-
Initialize indicator with available price value
-
Get results for initialized values
-
Use nextValue to get next indicator values for further tick.
javascriptvar sma = new SMA({period : period, values : prices}); sma.getResult(); // [5.5, 6.6, 7.7, 8.9] sma.nextValue(16); // 10.1Note: Calling nextValue will not update getResult() value.
Precision
This uses regular javascript numbers, so there can be rounding errors which are negligible for a technical indicators, you can set precision by using the below config. By default there is no precision set.
javascriptconst technicalIndicators = require('technicalindicators'); technicalIndicators.setConfig('precision', 10);
Contribute
Create issues about anything you want to report, change of API's, or request for adding new indicators. You can also create pull request with new indicators.
Environment dependencies
Typescript: Use typescript 2.0.0 other you might get max call stack reached error.
npm install -g typescript@2.0.0
TechnicalIndicators depends on the canvas package, which requires some dependencies to be installed. You can find the instructions to do that here. If you do not install these dependencies, expect to get this error message during the installation of TechnicalIndicators:
> canvas@1.6.6 install /Users/balupton/Projects/trading/technicalindicators/node_modules/canvas
> node-gyp rebuild

./util/has_lib.sh: line 31: pkg-config: command not found
gyp: Call to './util/has_lib.sh freetype' returned exit status 0 while in binding.gyp. while trying to load binding.gyp
Setup
bashgit clone git@github.com:anandanand84/technicalindicators.git # or use your fork cd technicalindicators npm run start
Running tests and getting coverage
bashnpm test npm run cover
Adding new indicators
- Add tests for the indicator and make them pass.
(It would be better if a sample of the stockcharts excel is used for the test case.) - Add the indicator to the
index.jsandsrc/index.ts - Run build scripts:
npm run build-lib && npm run generateDts && npm run start - Add it to
README.md, with the link to the runkit url containing the sample. - Add indicator it to keywords in
package.jsonandbower.json - Send a Pull Request.
Verify Documentation
bashnode testdocs.js open "http://localhost:5444/testdocs.html"
Donate
- XRB:
xrb_1shh8i77upiq4bjzi3ajik9ofq14bbcucshoapi3m7f8d74dc5k31o56yj5r - ETH:
0x0B56580Eb25f3F7e366dDA697161d314C17Bcb6a - LTC:
LLTUhKBRKs9sbW9F8MFQm7VVdZ1dJnXzGc - BTC:
1FGeJHoj7tjeLrm4JNtyPWTdBKPJjcqP6Y - BCH:
1AUFc8CEfHVjnoixbqTbX62WV8DZkpC1DU
Contributors
Showing top 12 contributors by commit count.