Google Map Card
Google Maps Card for Home Assistant
* **Route Search and Travel Time Calculator** 🆕 * **NEW (v5.0.2): Map-based route info bar, clickable route polylines, fullscreen panel overlay, active shortcut highlighting, and theme-consistent button colors** * **v5.0.0: Docked travel panel with real-time route calculation, live traffic-colored polylines, address autocomplete, route shortcuts, and multi-modal support (driving/walking/transit/cycling)** * Live Traffic Info * Weather Layers (via OpenWeather API Key) with adjustable opacity, br... The project is written primarily in JavaScript, distributed under the MIT License license, first published in 2025. Key topics include: commute, driving, driving-mode, google-maps, google-maps-card.
Google Maps Card for Home Assistant
![]()


![]()


Responsive Lovelace custom Google Maps card that displays the location of person., device_tracker., and sensor. entities and tracks their routes using the Google Maps JavaScript API including Live Traffic, Street View, POI Filtering, Map Types, FlightRadar24 Integration and Route Search and Travel Time Calculator support
Features
- Route Search and Travel Time Calculator 🆕
- NEW (v5.0.2): Map-based route info bar, clickable route polylines, fullscreen panel overlay, active shortcut highlighting, and theme-consistent button colors
- v5.0.0: Docked travel panel with real-time route calculation, live traffic-colored polylines, address autocomplete, route shortcuts, and multi-modal support (driving/walking/transit/cycling)
- Live Traffic Info
- Weather Layers (via OpenWeather API Key) with adjustable opacity, brightness, contrast and saturation
- FlightRadar24 integration support
- NEW (v4.0.0): Dedicated FlightRadar panel + airport arrivals/departures table + Add/Remove Flight directly on the map via right click button
- Create Zone, Edit Zone, Delete Zone directly from the card (right click / long press)
- Show Zones
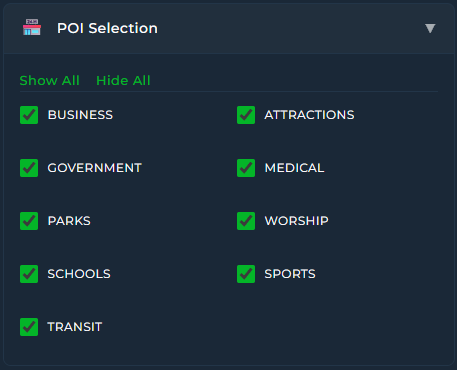
- POI Filtering
- Street View
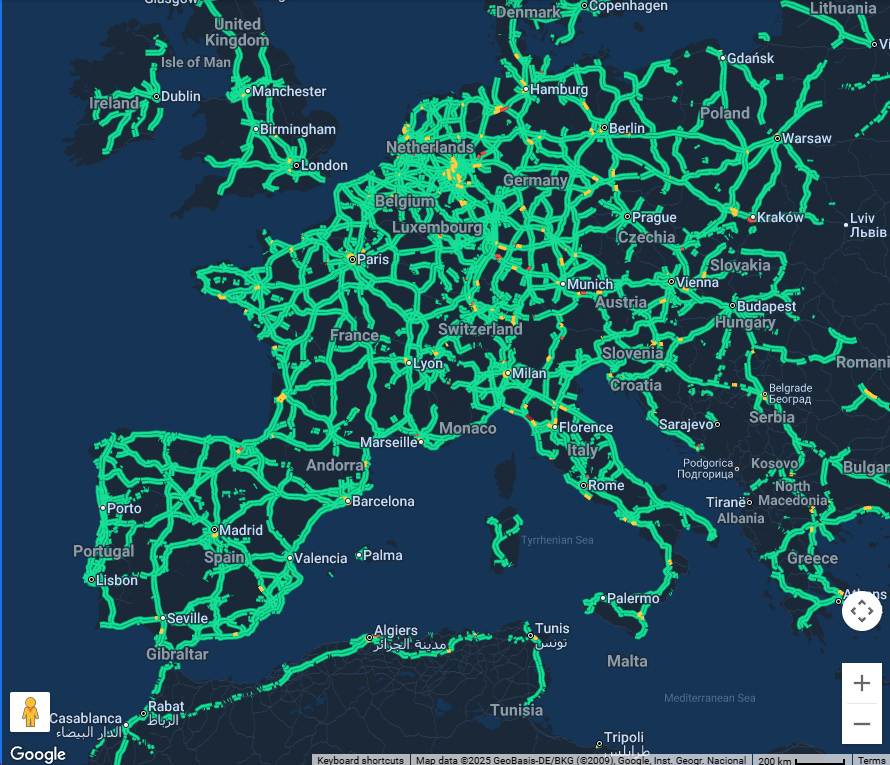
- Route tracking (polylines + history dots)
- Themes (40+ built‑in)
- Interactive Google Map view
- Dynamic selection of person/zone/device_tracker entities
- Geo Location sources auto-listing (from HA geo integrations)
- Map terrain types (Map, Satellite, Hybrid, Terrain)
- Custom zoom level
- Fully responsive iframe layout with
aspect_ratio - Show/hide map controls (Pan, Zoom, Street View, Fullscreen, Map Type, Rotate)
- Control positions of buttons
- Scale bar and keyboard shortcuts support
- Follow mode: auto‑center map on selected entity/entities
- Marker clustering (history dots) for performance on slower systems
- Proximity clustering (entities grouped within a radius until zoom >= 17)
- Spiderfy / overlap separation (high zoom) for entities with the exact same location
- GPS Accuracy visualization
- Accuracy styling via
gps_accuracy_ranges - NEW (v4.0.0): optional GPS accuracy radius line + label per entity
- Accuracy styling via
- External Date Control 🆕 (v5.0.9)
- Bind history date range to Home Assistant
input_datetimeentities — single day or explicit start/end range - Multiple cards stay in sync, perfect for tracking dashboards with markdown logs
- Bind history date range to Home Assistant
- Map & Format Language 🆕 (v5.0.9)
- Choose map labels and date/number formatting independently from your HA profile language
- Dynamic Zoom 🆕 (v5.0.10)
- The
zoomfield now accepts a Home Assistant entity (input_number,sensor) for real-time zoom control
- The
- History Dot Shapes 🆕 (v5.0.10)
- Per-entity dot customization: circle, square, triangle, diamond, star, pentagon — filled or outline
- Dot size auto-scales with polyline width, or can be set manually
 <br>
<br>
Attention
💡 Google Maps JavaScript API must be enabled in your Google Cloud project:
https://console.cloud.google.com/google/maps-apis/api-list
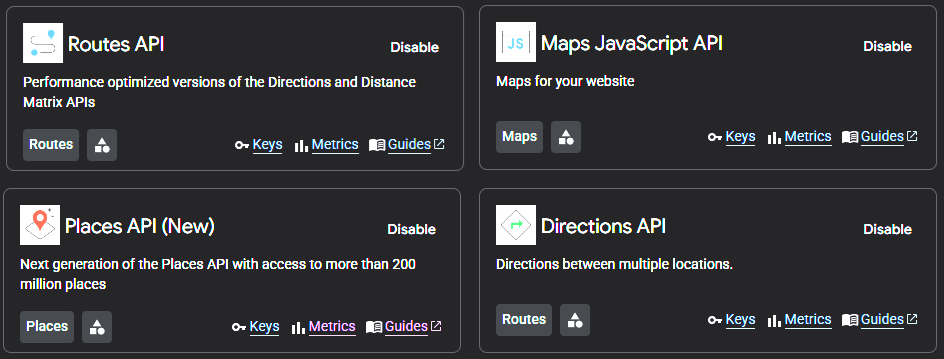
If you plan to use the Route Search and Travel Time Calculator, you also need to enable these additional APIs:
| API | Purpose | Required for |
|---|---|---|
| Maps JavaScript API | Core map rendering | All features (required) |
| Directions API | Route calculation, alternatives, duration & distance | Route Search and Travel Time Calculator |
| Places API (New) | Address autocomplete in travel panel | Route Search and Travel Time Calculator |
| Routes API | Real-time traffic segment data for color-coded polylines | Route Search and Travel Time Calculator |
💰 API Pricing & Free Quotas — You're Probably Fine
Google Maps Platform follows a "Pay-as-you-go" model, but don't let that scare you — Google provides a very generous free tier that comfortably covers typical Home Assistant usage. Most home users will never come close to the limits.
Here's how much you get for free every month (as of March 2025):
| Feature | Required API | Free Monthly Limit | What That Means for You |
|---|---|---|---|
| Core Map Rendering | Maps JavaScript API (Dynamic Maps) | 10,000 map loads | ~330 map loads/day — plenty for a household dashboard |
| Route Calculation | Directions API | 10,000 requests | ~330 routes/day — way more than daily commute checks |
| Address Autocomplete | Places API (New) | 10,000 requests | ~330 autocomplete sessions/day |
| Live Traffic Routes | Routes API | 5,000 – 10,000 requests | More than enough for regular route queries |
To put this in perspective: if you open your HA dashboard 10 times a day and calculate 5 routes, that's still only ~450 map loads and ~150 API calls in a month — well under 5% of your free quota. You'd need to be loading the map hundreds of times daily to even approach the limits.
💡 In short: For personal / household use, the free tier is more than enough. You won't pay a cent unless you do something unusual.
To use all features of this card (including the Route Calculator), you need to enable the required APIs in your Google Cloud project: API List
❓ Why does my Quotas page say "Unlimited"?
If you check your Google Cloud Quotas page, you might see "Unlimited" next to Map loads per day. This doesn't mean you'll be charged without warning — it just means Google won't technically block your requests if traffic spikes. Billing only kicks in after the 10,000 monthly free loads, and for a typical home setup you'll stay well within that.
That said, if you want extra peace of mind (always a good idea!), you can set a daily cap yourself:
🛡️ Optional Safety Steps (Recommended)
These are simple one-time steps to make sure you're fully protected — they only take a minute:
- Set a daily quota cap — Go to APIs & Services → Quotas and lower the "Unlimited" daily limit to something comfortable (e.g., 200/day). This creates a hard ceiling so you can never accidentally exceed the free tier.
- Create a budget alert — Go to Billing → Budgets & Alerts and set a $1–2/month alert. Google will email you if costs approach your threshold. Think of it as a smoke detector — you'll probably never hear it, but it's nice to have.
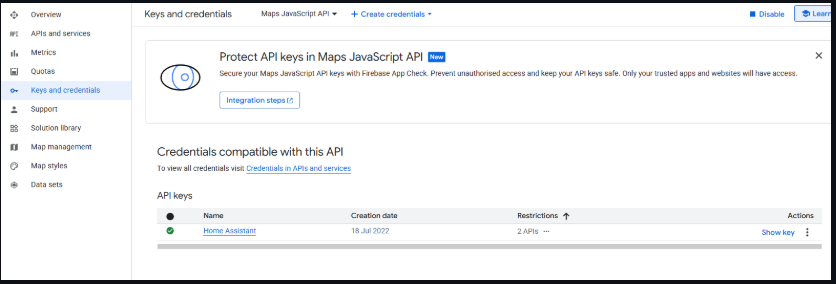
- Restrict your API key — Limit it to only the APIs you actually use.
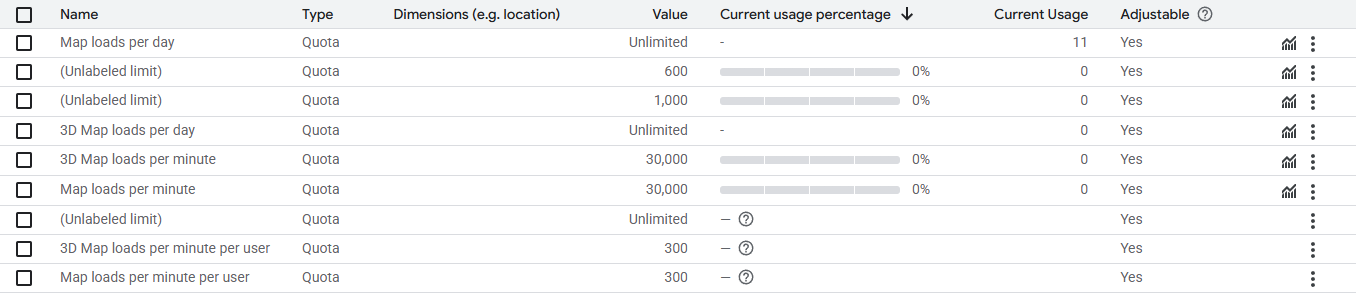
You can always check your actual usage here: Google Maps API Quotas
For a great walkthrough on setting up your API key safely, check out this video by @BeardedTinker:
https://youtu.be/usGLOxtXCxA?si=BxDj65bksi_tcZek
🚗 Route Calculator — Built-in Safety Net
Each route calculation triggers multiple API calls behind the scenes (Directions + Routes + Places autocomplete), so 50 route calculations could mean ~150+ total API calls. To keep things safe by default, this card has a built-in soft limit of 50 route calculations per day per API key (shared across all browser instances). That's still plenty for daily use — you'd have to actively try to hit it.
💡 For the best protection, combine this built-in limit with a hard daily quota in your Google Cloud Console (see the safety steps above). Belt and suspenders!
Create your API key and click the “Show key” button in the console:
<br>>
Installation
Via HACS
- Go to HACS
- Search for Google Map Card
- Download & install
Adding the Card to Dashboard
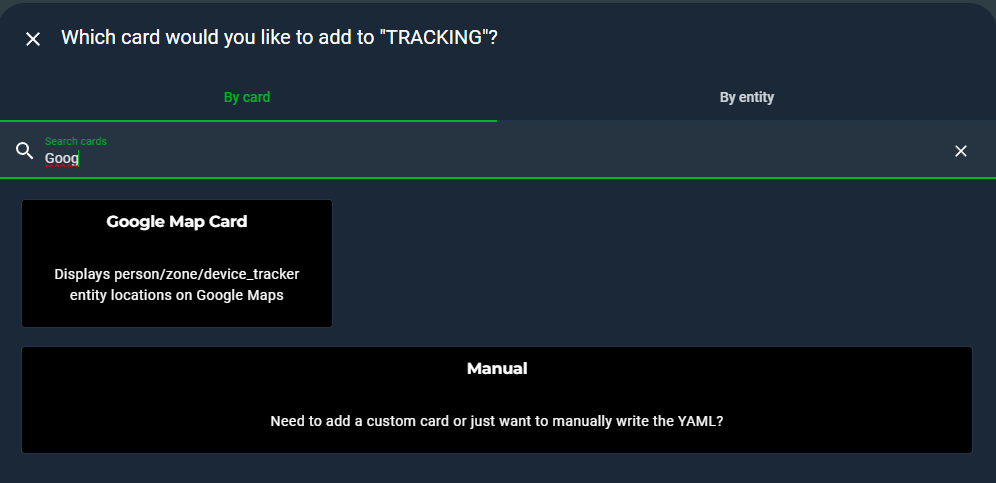
Add via the Lovelace card picker (search “Google Map Card”)
or define it in YAML (see Card Example below):
📐 Dashboard Layout Tips
Standard Dashboard (Masonry / Panel)
Use aspect_ratio to control the card height:
yamltype: custom:google-map-card api_key: YOUR_API_KEY aspect_ratio: "16:9" # or 4:3, 1:1, 400px, etc.
Sections Dashboard
If you are using Home Assistant’s Sections dashboard layout, the recommended approach is to use aspect_ratio** and rows: auto
yamltype: custom:google-map-card api_key: YOUR_API_KEY grid_options: columns: full rows: auto
With rows: auto the card height is determined by aspect_ratio
💡 Tip: Leaving
aspect_ratioempty without settinggrid_options: columns: fullmay cause the card to render with zero height on some Sections layouts. Always use one approach or the other.
Panel Layout
If you are using Home Assistant’s Panel dashboard layout, the recommended approach is to leave aspect_ratio* empty
UI Card Editor
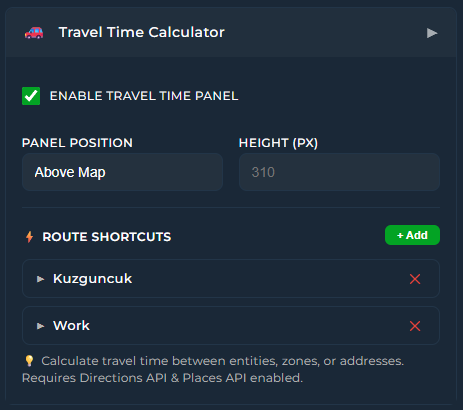
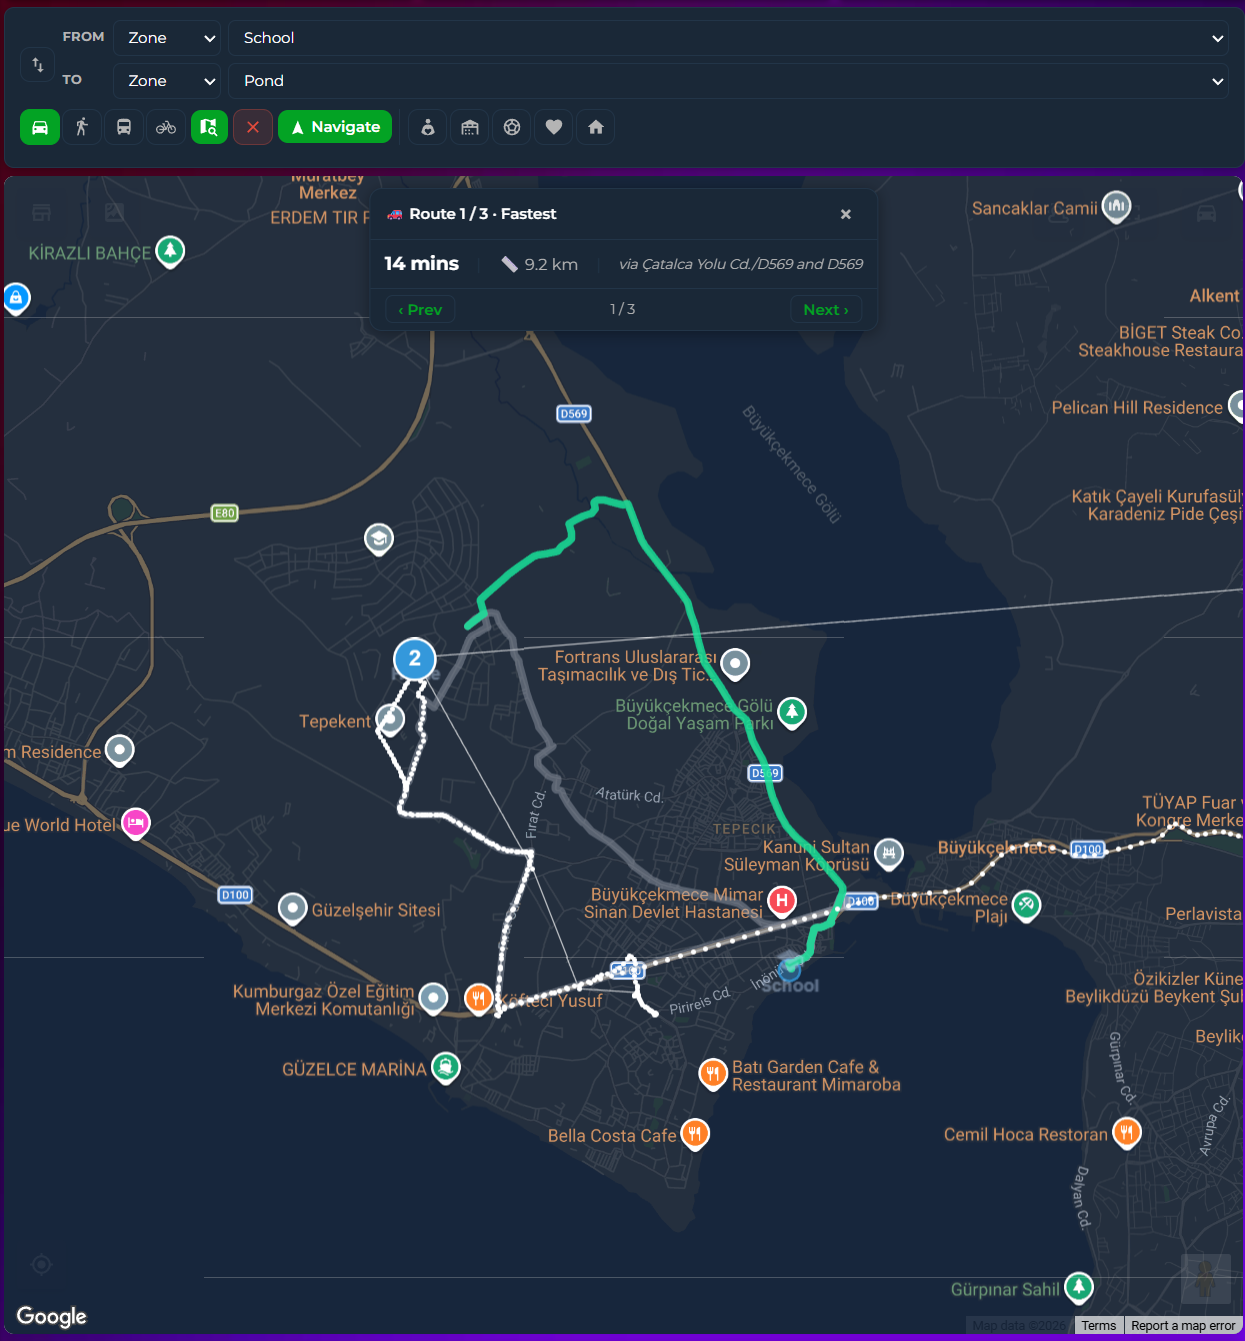
🚗 Route Search and Travel Time Calculator (v5.0.4)
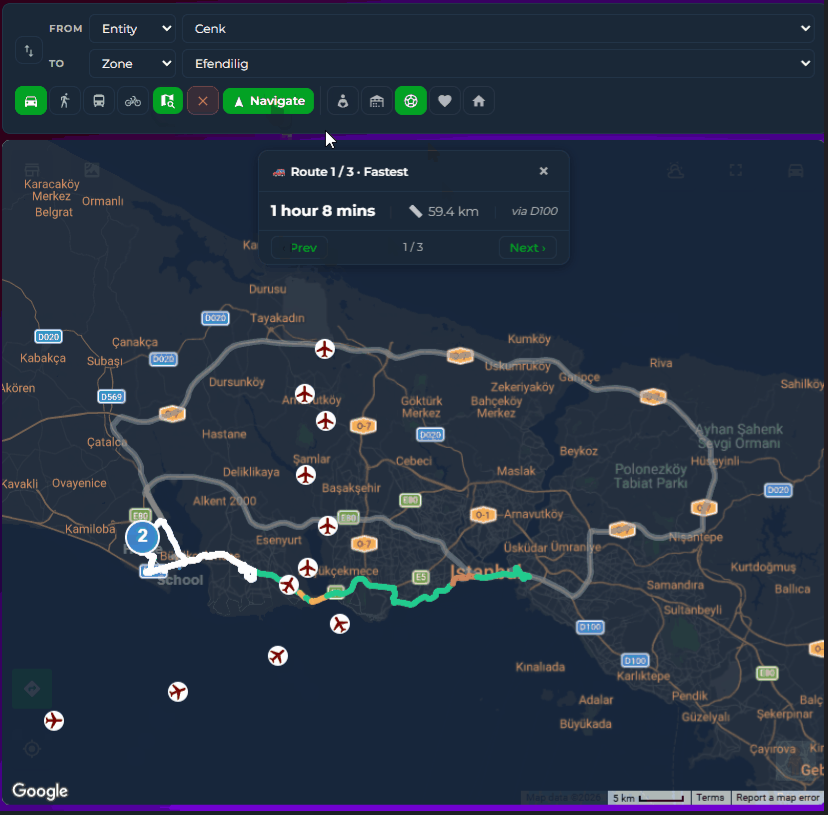
Calculate real-time travel times between any combination of entities, zones, or typed addresses — directly from your dashboard. The panel supports driving, walking, transit, and cycling modes with live traffic visualization on the map.
What you get
- Docked travel panel with flexible positioning (above / below the map)
- Map-based route info bar — after calculating, a compact bar appears at the top of the map showing travel time, distance, and route name. No list, no clutter.
- Multi-modal routing — Driving 🚗, Walking 🚶, Transit 🚌, Cycling 🚴
- Live traffic-colored routes for driving mode:
- 🟢 Green — Normal flow
- 🟡 Yellow — Slow traffic
- 🔴 Red — Heavy traffic / Traffic jam
- Alternative routes — click any route line on the map or use Prev / Next in the info bar to switch between options
- Address autocomplete — powered by Places API (New) with instant suggestions
- Route Shortcuts ⚡ — define frequently used routes with custom icons and labels for one-tap calculation
- Selected shortcut is highlighted so you always know which one is active
- Supports
person,device_tracker, andzoneentities - Collapsible editor with label-based headers
- Toggle button on the map to show/hide the panel — optional, position configurable in Map Button Positioning. Panel opens automatically on first load.
- Fullscreen support — the panel and route info bar stay visible in fullscreen mode, anchored to the bottom of the screen
Required APIs
The Route Search and Travel Time Calculator requires these additional APIs to be enabled in Google Cloud Console:
- Directions API — Route calculation
- Places API (New) — Address autocomplete
- Routes API — Traffic segment data
🌍 Map & Format Language
By default, the card uses your Home Assistant profile language for map labels (city names, streets) and in-card date/number formatting. If you'd like the map to display in a different language — for example, you run HA in English but want city names in your native script (Cyrillic, Japanese, Arabic, etc.) — set the language option.
yamltype: custom:google-map-card api_key: YOUR_API_KEY language: ja # BCP-47 tag: en, tr, de, ja, ru, he, ar, etc. entities: - person.alice
You can also pick the language from the visual editor's Map Language dropdown.
⚠️ Google Maps reads the language only at script load time. After changing this setting, do a full page reload (Ctrl+Shift+R) for map labels to update.
Leave the option empty (or omit it) to fall back to your Home Assistant profile language.
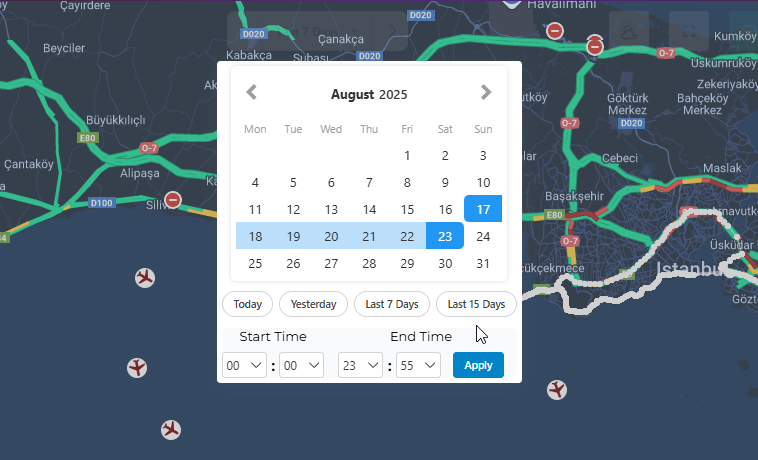
📅 External Date Control
You can bind the card's history date range to one or more Home Assistant input_datetime entities. This lets a single date picker on your dashboard drive both the map and other cards (markdown logs, tables, statistics) at the same time — no more selecting the date twice.
Two modes
Single day — one entity, automatically expanded to that day's full 00:00–23:59 range:
yamltype: custom:google-map-card api_key: YOUR_API_KEY history_date_entity: input_datetime.map_date entities: - person.alice - person.bob
Date range — explicit start and end (each with optional time):
yamltype: custom:google-map-card api_key: YOUR_API_KEY history_start_entity: input_datetime.history_start history_end_entity: input_datetime.history_end entities: - person.alice
Required Home Assistant helpers
Create the helpers under Settings → Devices & Services → Helpers → + Create Helper → Date and/or time, or in YAML:
yamlinput_datetime: map_date: name: Map Date has_date: true has_time: false history_start: name: History Start has_date: true has_time: true history_end: name: History End has_date: true has_time: true
How it works
- The map updates automatically whenever the
input_datetimevalue changes - The internal date picker button becomes read-only — clicking it shows a tooltip indicating the date is controlled externally
- Multiple cards bound to the same entity stay in sync
- All
input_datetimeformats are supported: date-only, time-only, date + time, and the underlyingtimestampattribute - If both single-date and range entities are configured, the range form takes precedence
- Configurable from the visual editor in the External Date Control section
Use case: synchronized tracking dashboard
Combine with previous/next day scripts and a markdown card to build a tracking dashboard where one date picker drives everything:
yamlscript: datepicker_previous_day: sequence: - service: input_datetime.set_datetime target: entity_id: input_datetime.map_date data: date: > {{ (states('input_datetime.map_date') | as_datetime - timedelta(days=1)).strftime('%Y-%m-%d') }} datepicker_next_day: sequence: - service: input_datetime.set_datetime target: entity_id: input_datetime.map_date data: date: > {{ (states('input_datetime.map_date') | as_datetime + timedelta(days=1)).strftime('%Y-%m-%d') }}
Bind the same input_datetime.map_date to both the map card and any markdown / entity / table card on the dashboard, and they'll all show the same day's data.
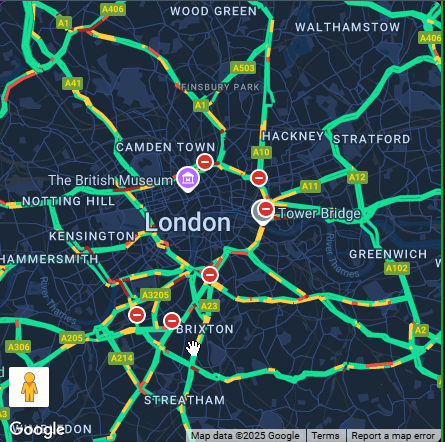
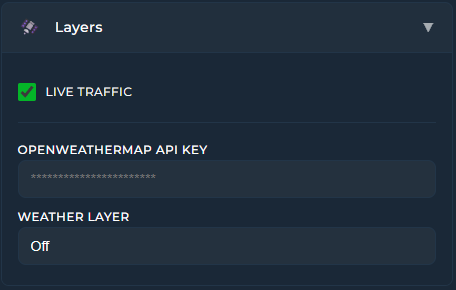
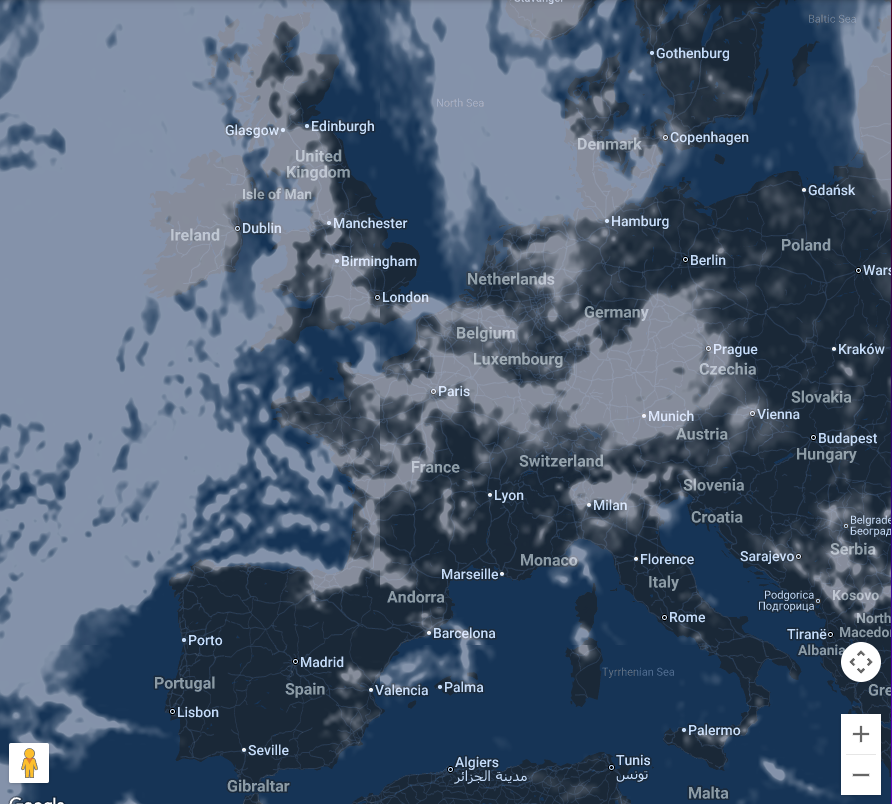
Live Traffic Info by Google Maps
Optional. Real time traffic layer
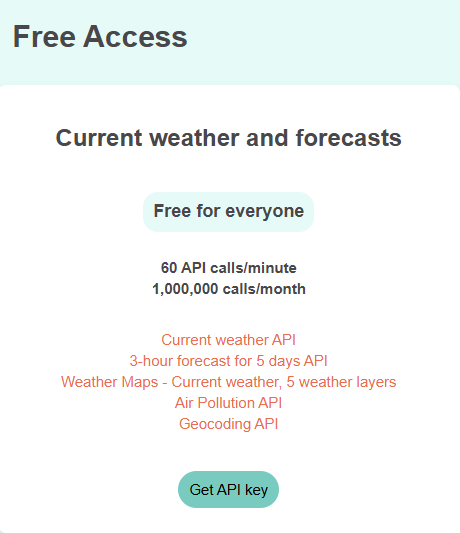
Live Weather Layer by OpenWeather API (Optional)
You need to create api key from openweathermap.org. Please create API v1.0. It is free. Please find the section below and create free API on https://openweathermap.org/price. DO NOT create API of One Call API 3.0
API v1.0 is enough and it is free.
Weather Layer Appearance
By default, the weather layer renders at 60% opacity. Some layers (especially temperature) can obscure the map underneath. You can fine-tune how the layer looks using four settings, all available in the visual editor under the Layers section:
yamlweather_layer: temp_new weather_layer_opacity: 0.4 # more transparent so the map stays visible weather_layer_brightness: 0.9 # slightly dimmed weather_layer_contrast: 1.4 # sharper weather patterns weather_layer_saturation: 0.6 # softer colors
All four default to sensible values and only need to be set when you want to override them.
Google Maps & Apple Map Application Support
You can open any point or location of your entities on Google Map or Apple Map mobile or web browser app.
For entity location: Click on entity picture and select your app on the opened popup
For any point on the map (Windows): Right click and select your app on the opened popup
For any point on the map (Mobile Phone): Hold your finger on any point for 2 seconds and select your app on the opened popup
<br>💡 You can hide these links entirely by setting
hide_map_links: truein your card config.
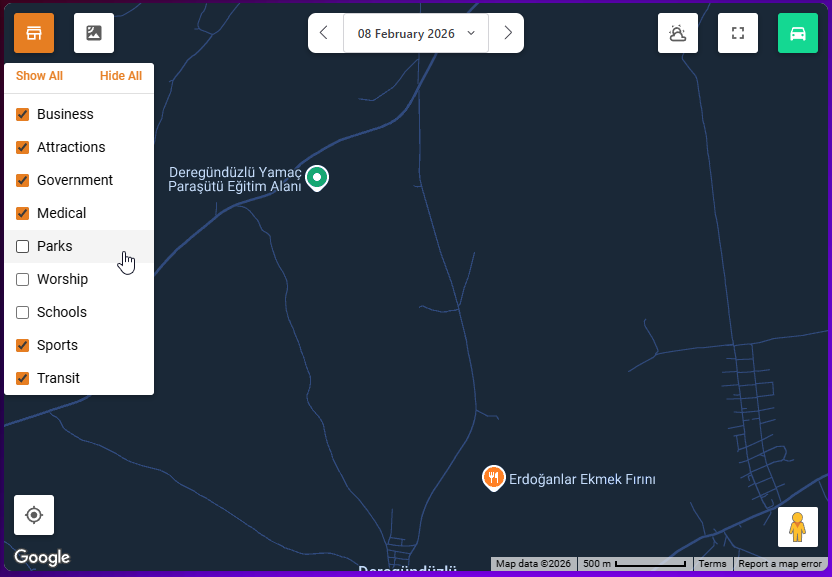
POI Filtering
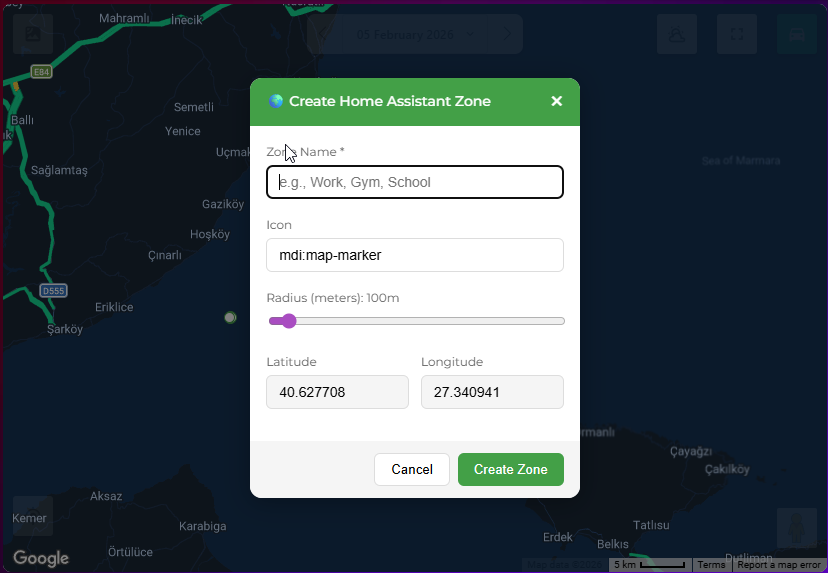
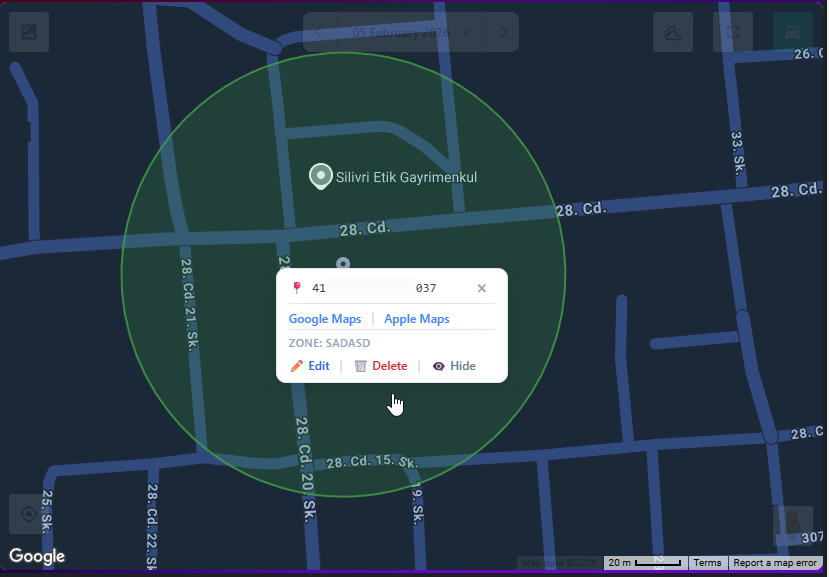
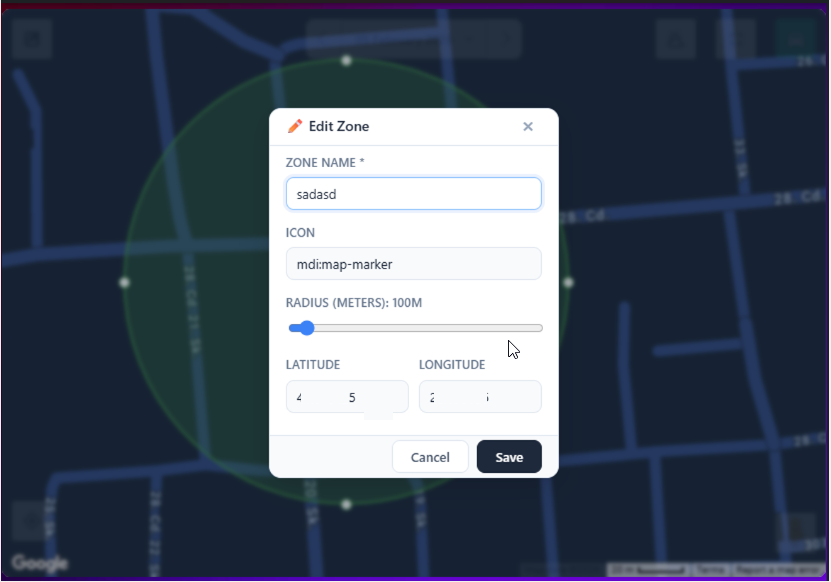
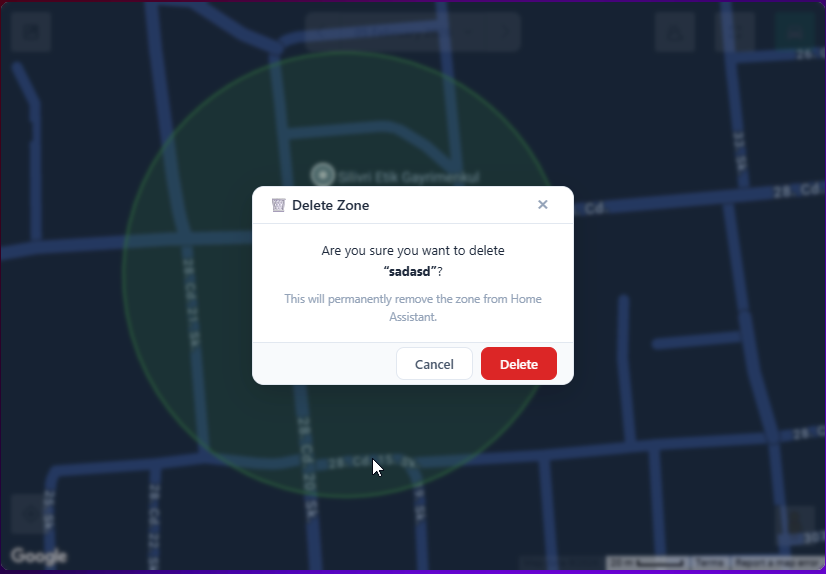
Create Zone, Edit Zone, Delete Zone and Hide Zone
(Right click on browser or hold touch on mobile)
Create Zone: Right click on map (outside a zone)
Edit Zone, Delete Zone and Hide Zone: Right click inside a zone
Adding Geo Location Sources
If you have any integration providing geo location source, they will be automatically listed on the bottom of entity list.
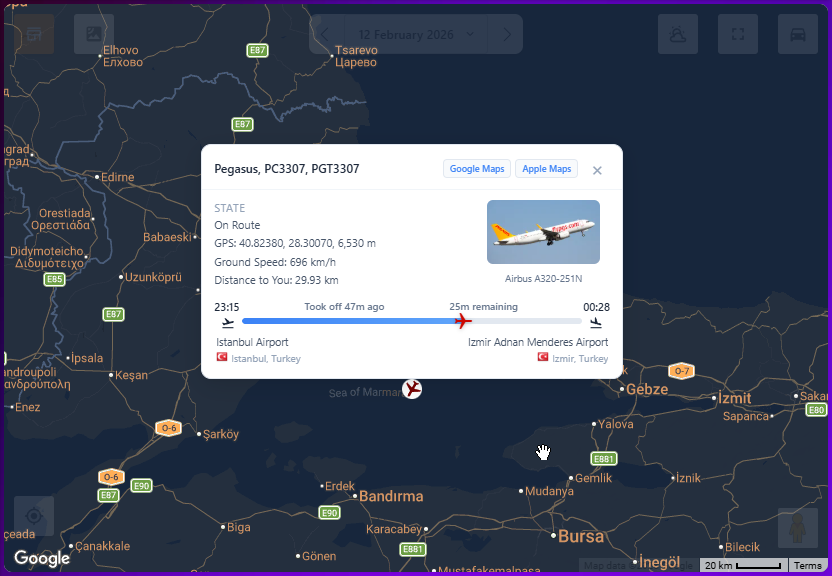
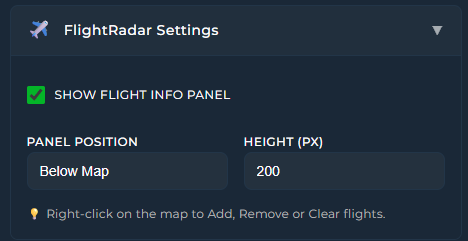
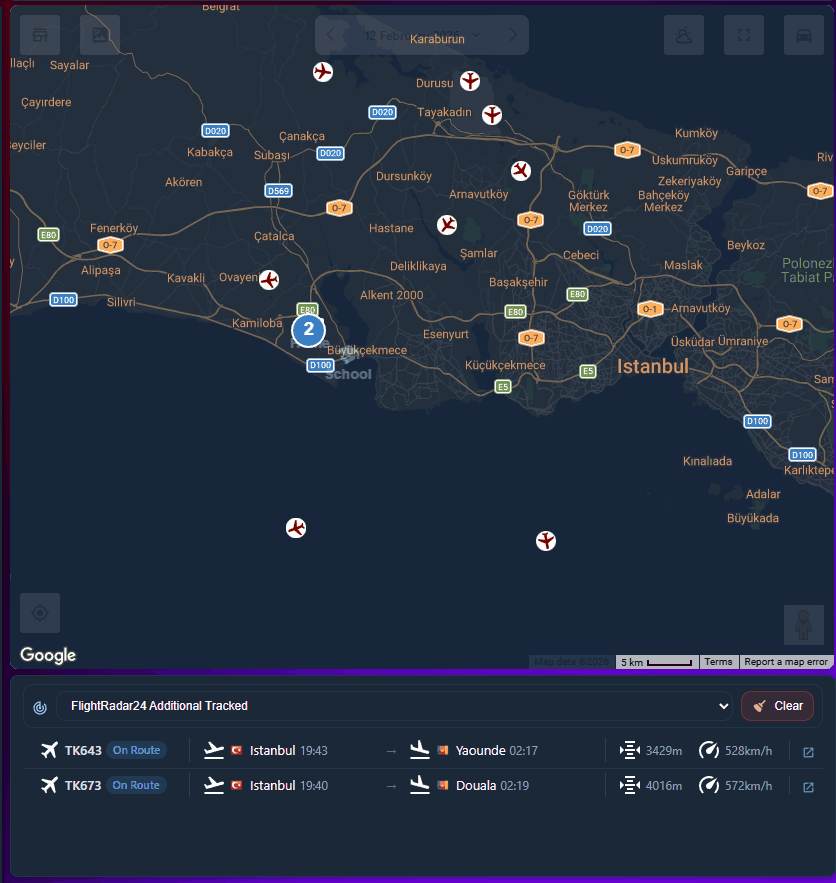
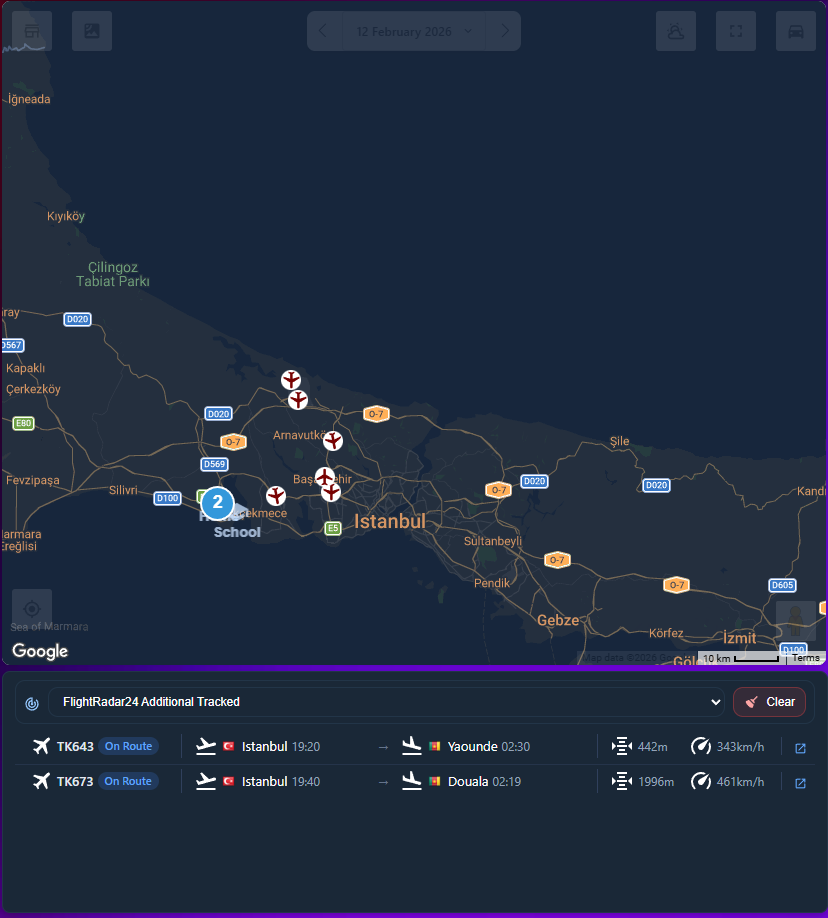
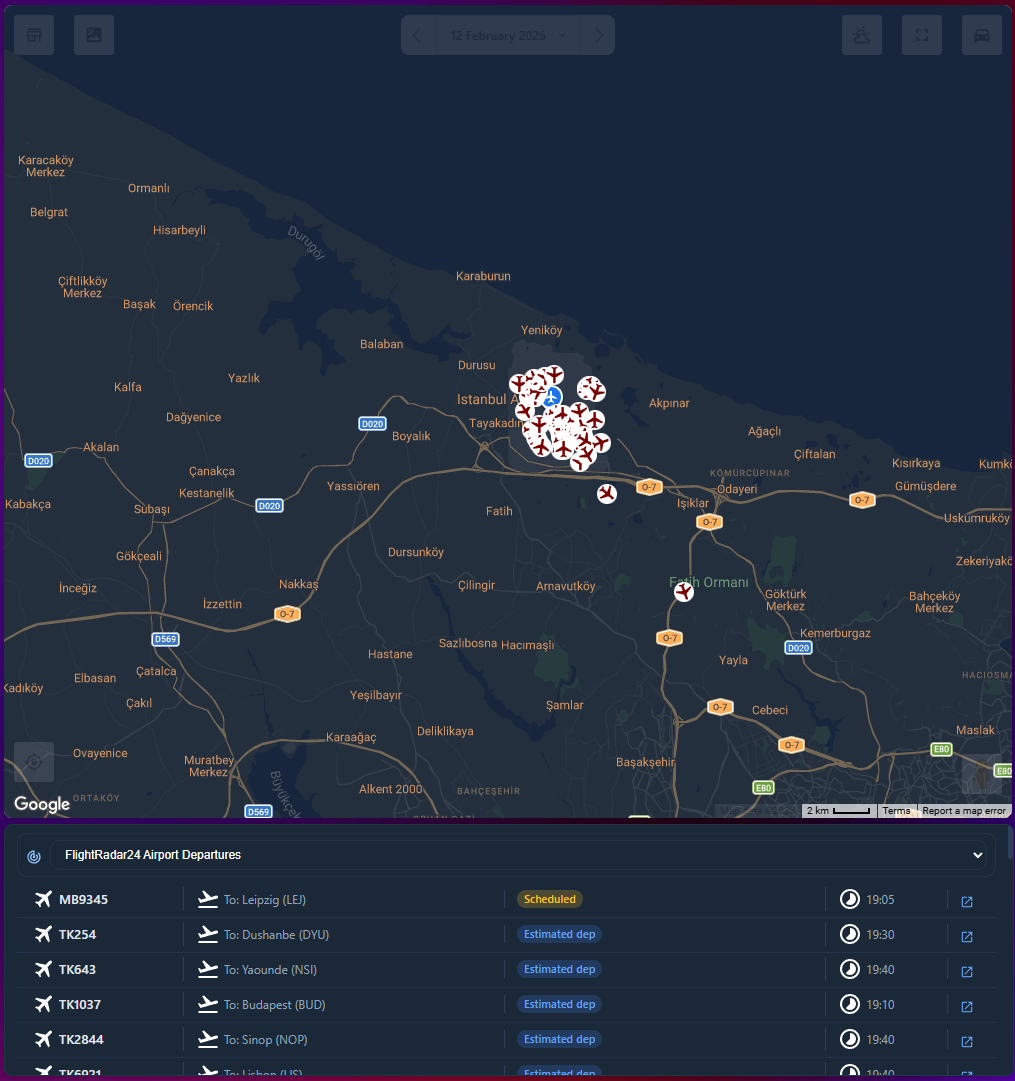
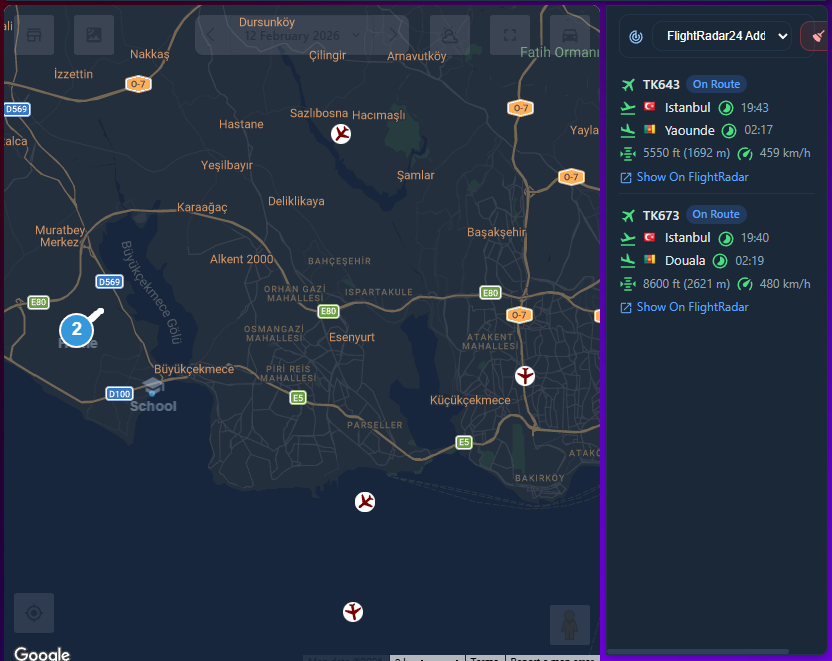
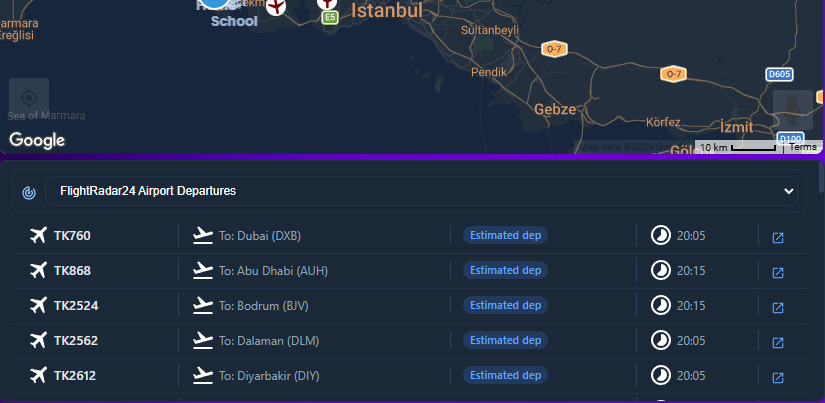
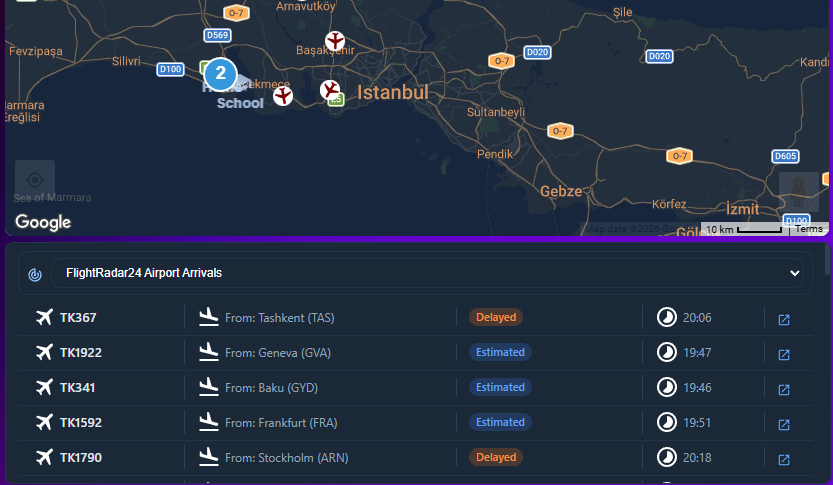
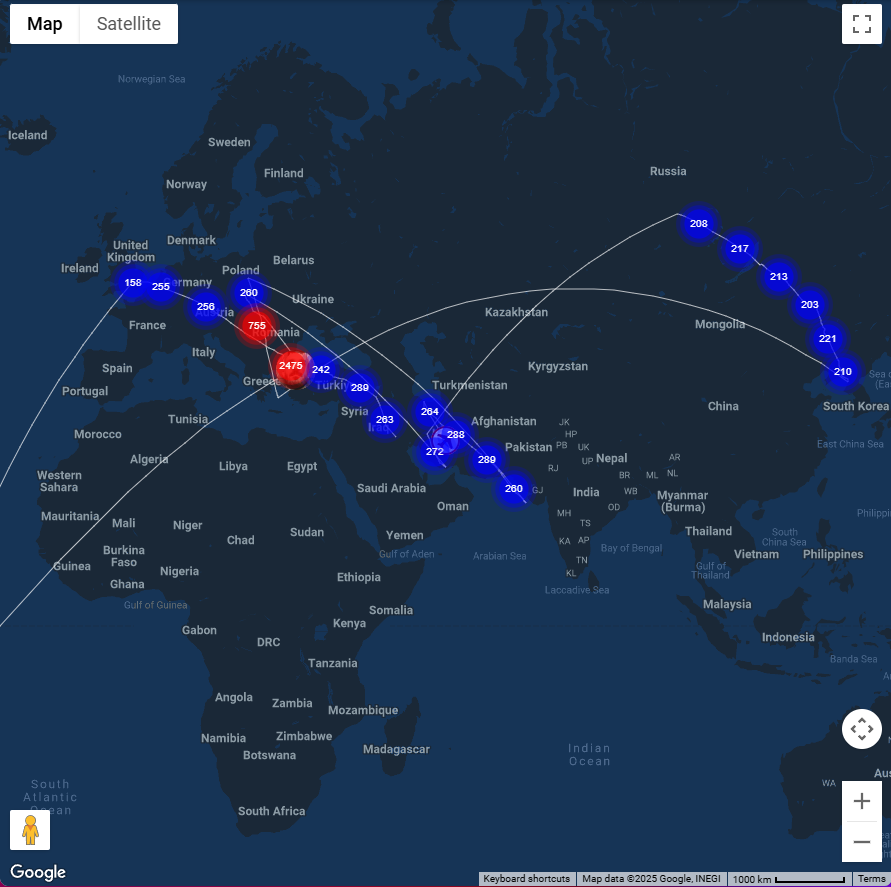
✈️ FlightRadar24 Support (v4.0.0)
This card supports FlightRadar24 entities and includes a dedicated FlightRadar panel to browse and manage flights.
What you get
-
FlightRadar panel with a richer UI and responsive layouts
- Horizontal panel (above/below)
- Sidebar panel (left/right)
-
Airport Arrivals / Departures support
- Status chips (Estimated / Landed / Scheduled / Delayed / On Route, etc.)
- Parses
status_textsuch asDelayed 16:25into a separate time column
-
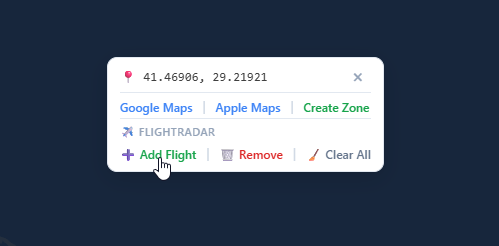
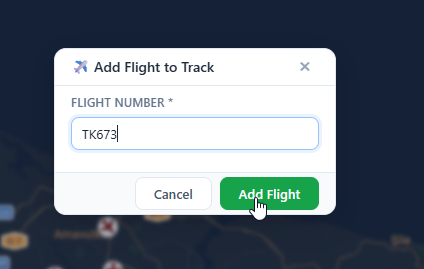
Quick actions available from the map RIGHT CLICK popup (when FR24 is detected)
- Add Flight
- Remove Flight
- Clear Flights
Configuration
yamltravel_panel_enabled: true travel_panel_position: below # above | below show_travel_panel_toggle_button: true show_travel_panel_toggle_button_position: LEFT_BOTTOM travel_shortcuts: - label: "Go to Work" icon: "mdi:office-building" from_entity: "person.cenk" to_entity: "zone.office" - label: "Go Home" icon: "mdi:home" from_entity: "person.cenk" to_entity: "zone.home"
Enabling Clustering (History Dots)
If you enable clustering, route history markers will be grouped depending on zoom level.
More zoom = more granularity. This increases performance on slow systems.
Note (v4.0.0): FlightRadar markers are excluded from clustering by design.
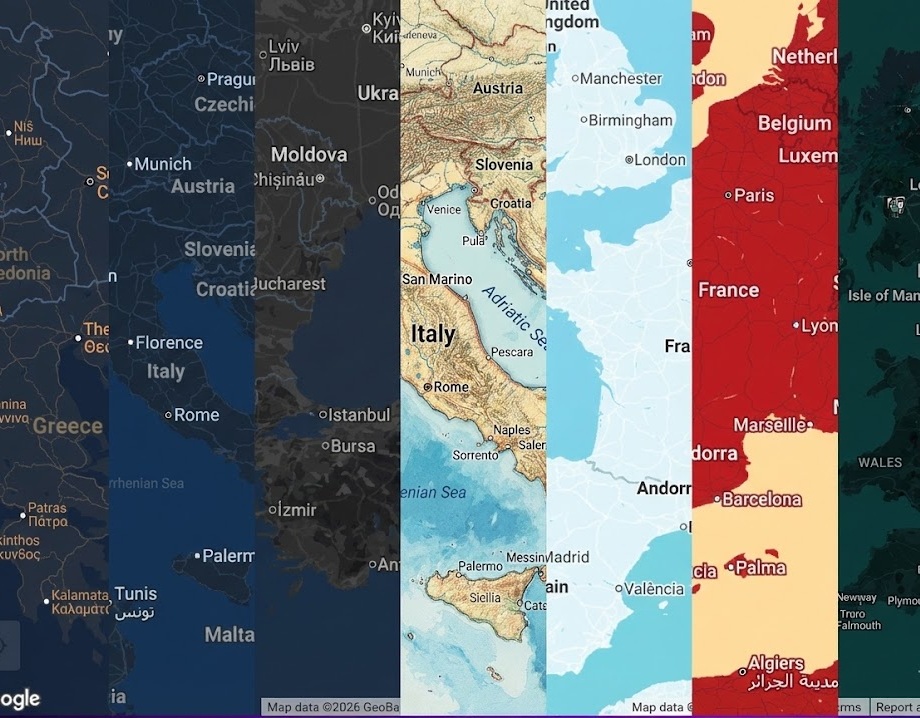
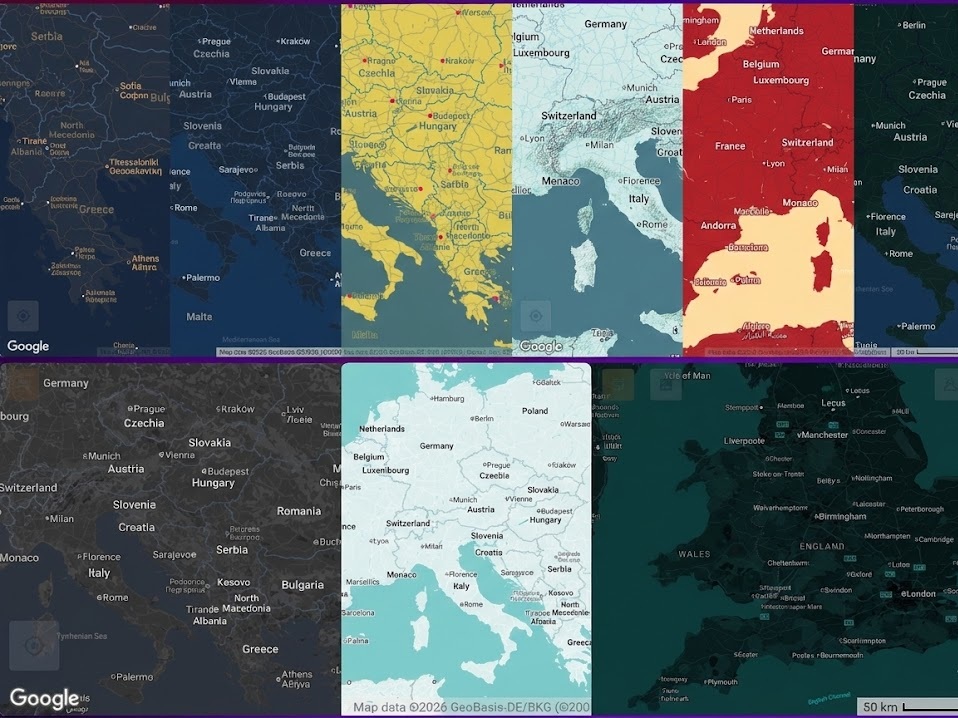
Themes
You can choose your best theme—40 now and more to come!
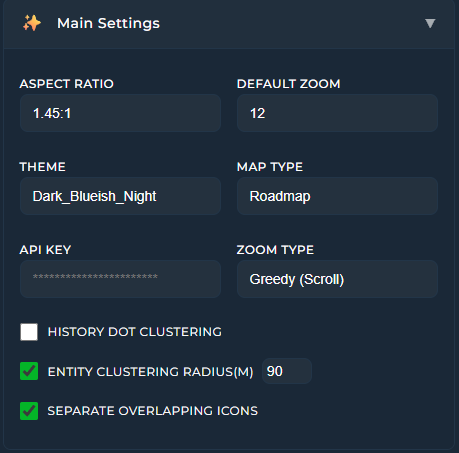
🔧 Parameters
🧹 General Options
| Key | Type | Description |
|---|---|---|
type | string | Required for Home Assistant custom card. Must be custom:google-map-card. |
api_key | string | Your Google Maps JavaScript API key (required). |
zoom | integer / string | Initial zoom level (1–22). Accepts a static number (e.g. 12) or a Home Assistant entity ID (e.g. input_number.map_zoom) for dynamic zoom control. |
theme_mode | string | Map theme name from built-in themes (Dark_Blueish_Night, etc.). Not available when rendering_type: vector — use color_scheme instead. |
rendering_type | string | Map rendering engine. raster (default) or vector. Vector mode enables free 360° rotation and tilt on all map types. See Vector Map & Free Rotation below. |
color_scheme | string | Color scheme for vector mode only. light (default), dark, or follow_system. Has no effect when rendering_type: raster. |
aspect_ratio | string | Card aspect ratio (16:9, 4:3, 1, 1:1.56, 400px, etc.). If omitted, the card expands to fill its container — recommended for Sections dashboard users who set grid_options: columns: full. See Dashboard Layout Tips below. |
map_type | string | Map type: roadmap, satellite, hybrid, or terrain. Default: roadmap. |
gesture_handling | string | cooperative for CTRL+SCROLL, greedy for just SCROLL, auto |
marker_clustering | boolean | If true, history dots will be grouped depending on zoom level. Increases performance for slow systems. |
proximity_clustering | boolean | If true, entities within the defined radius will be grouped until zoom level is higher than 17 |
proximity_radius | number | Radius of proximity cluster default: 150 |
spiderfy | boolean | If true, after some zoom level, icons of entities with exact location will be separated by some distance in order to see all icons |
allow_open_google_maps | boolean | Allow opening Google Maps from info popups via right-click / long-press. Default: true. |
hide_map_links | boolean | Hide Google Maps & Apple Maps links from all info popups. Default: false. NEW (v5.0.4) |
history_preset | string | Relative date range preset. Accepted values: today, yesterday, last7, last15. When set, the date range is recalculated on every page load relative to the current date — so it never goes stale. Overrides history_start_date / history_end_date. |
history_start_date | string | Fixed start of the date range (ISO 8601, e.g. "2026-02-20T21:00:00.000Z"). Used only when history_preset is null. |
history_end_date | string | Fixed end of the date range (ISO 8601). Used only when history_preset is null. |
⚠️ Naming note: Older docs may mention
marker_clustring/clustring. The correct key ismarker_clustering.
📅 Migration note (v4.0.2):
history_start_dateandhistory_end_datehave moved from per-entity to card-level. The per-entity booleanuse_date_range: truenow opts an entity into the shared card-level date range. Old configs with per-entity dates will be auto-migrated on first edit.
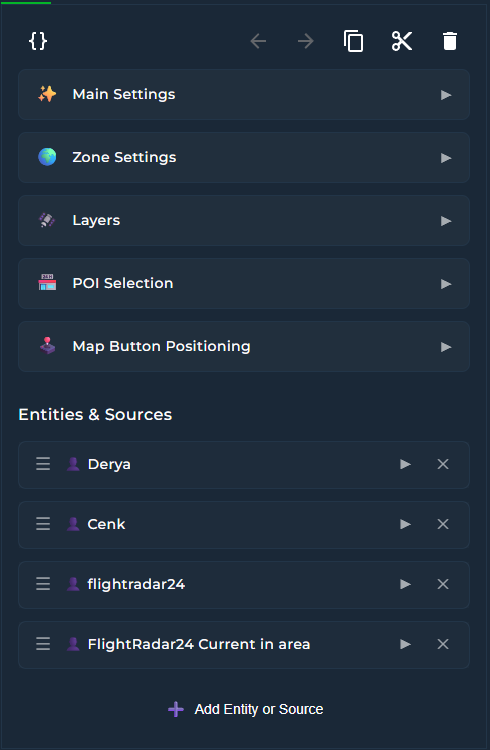
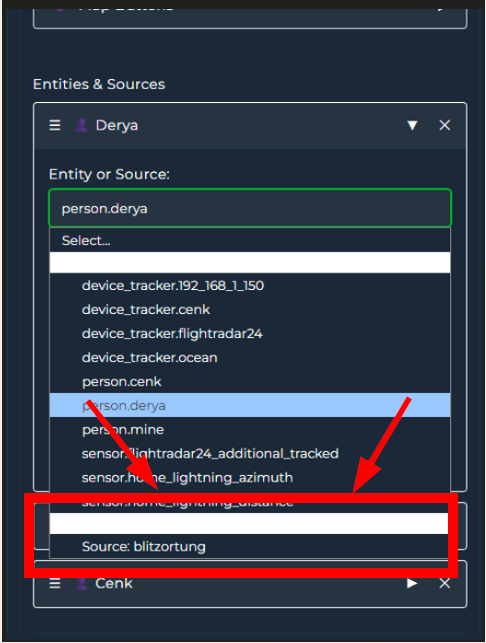
👤 Entities
| Key | Type | Description |
|---|---|---|
entities | list | A list of device_tracker, person, or zone entities to show on the map (required if no geo location sources provided). |
entity | string | Entity ID to track. |
icon_size | integer | Size of the icon for this entity. |
icon_color | string | Icon color (e.g., #ffffff). |
background_color | string | Background color of the icon. |
hours_to_show | integer | Number of hours of location history to show. Use 0 to disable history. Ignored when use_date_range: true. |
polyline_color | string | Color of the polyline for route history. |
polyline_width | integer | Width of the polyline for route history. |
follow | boolean | If true, map will center on this entity. When multiple entities have follow: true, the map will fit all of them. |
show_history_dots | boolean | If false, location history dots are not rendered. May increase speed of map rendering for long time period data. |
history_dot_shape | string | Shape of history dots: circle (default), square, triangle, diamond, star, pentagon. Helps distinguish entities with similar colors. |
history_dot_size | integer | Size of history dots in pixels. When omitted, auto-derived from polyline width (4× polyline width, minimum 4px). |
history_dot_filled | boolean | If true (default), dots are filled solid. If false, dots are rendered as outlines only. |
use_date_range | boolean | If true, this entity uses the card-level date range (history_preset or history_start_date/history_end_date) instead of hours_to_show. When enabled, hours_to_show is ignored for this entity. |
gps_accuracy_ranges | obj | min,max,label,color,opacity see example below |
show_gps_accuracy_radius_line | boolean | NEW (v4.0.0) Draw a thin radius line + label showing GPS accuracy distance (zoom-aware) |
👤 Geo Location Sources
| Key | Type | Description |
|---|---|---|
geo_location_sources | list | Geo Location Sources listed in entity selection list (required if no entity provided). |
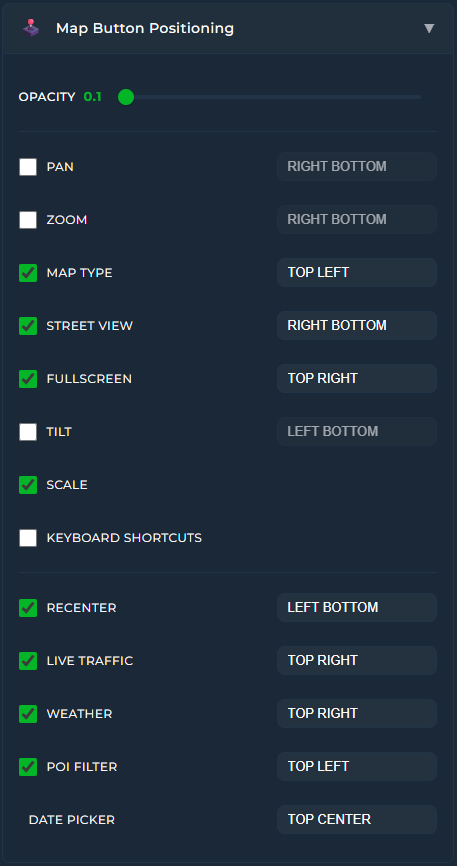
🕹️ Map Buttons
| Key | Type | Description |
|---|---|---|
cameraControl | boolean | In raster mode: shows/hides the native pan control. In vector mode: shows/hides a custom rotate & tilt grid (↑↓ tilt, ←→ rotate, ⟳ reset) — the native pan buttons are replaced entirely. |
zoomControl | boolean | Show or hide zoom control. |
streetViewControl | boolean | Show or hide Street View control. |
fullscreenControl | boolean | Show or hide fullscreen control. |
mapTypeControl | boolean | Show or hide map type selector. |
rotateControl | boolean | Show or hide rotate/tilt control. Limited support — only functional in satellite or hybrid map types, at high zoom levels (15+), and only in cities where Google provides 45° aerial imagery (e.g. New York, London, Tokyo). Has no effect on standard road maps. See Rotate & Tilt Limitations below. |
showScale | boolean | Show or hide the scale bar. |
show_poi_button | boolean | Show or hide the poi selector. |
keyboardShortcuts | boolean | Enable or disable keyboard shortcuts for navigation. |
show_traffic_button | boolean | Show or hide Traffic Layer Toggle Button. |
show_weather_button | boolean | Show or hide Weather Layer dropdown menu. |
show_datepicker_button | boolean | Show or hide Calendar. (use_date_range should be enabled for at least one entity) |
show_recenter_button | boolean | Show or hide Recenter Map Button. |
buttons_opacity | float | Opacity of all buttons on the map. Buttons will be solid when hover |
🌍 Localization & External Control
| Key | Type | Description |
|---|---|---|
language | string | BCP-47 language tag for map labels and date/number formatting (e.g. en, tr, ja, ru, he, de-DE). Leave empty to follow the Home Assistant profile language. Requires page reload after change. |
history_date_entity | string | input_datetime entity that controls the history date range. The selected day is automatically expanded to 00:00–23:59. |
history_start_entity | string | input_datetime entity for the start of an explicit date range. Used together with history_end_entity. |
history_end_entity | string | input_datetime entity for the end of an explicit date range. Used together with history_start_entity. If both range entities are set, they take precedence over history_date_entity. |
📚 Layers
| Key | Type | Description |
|---|---|---|
show_traffic | boolean | Show or hide live traffic. No extra api key needed |
weather_layer | string | Add weather layer. none, precipitation_new, pressure_new, wind_new, temp_new, clouds_new |
weather_layer_opacity | number | Transparency of the weather layer (0.0 = invisible, 1.0 = fully opaque). Default: 0.6 |
weather_layer_brightness | number | Brightness of the weather layer (1.0 = normal). Lower values darken, higher values brighten. Default: 1.0 |
weather_layer_contrast | number | Contrast of weather patterns (1.0 = normal). Increase to make patterns more visible. Default: 1.0 |
weather_layer_saturation | number | Color intensity of the weather layer (1.0 = normal, 0 = grayscale). Default: 1.0 |
owm_api_key | string | Create api and restrict it 1000 per day https://home.openweathermap.org/api_keys |
🔝 Button Positions
| Key | Type | Description |
|---|---|---|
cameraControl_position | string | Position of the pan control (e.g., RIGHT_BOTTOM). |
zoomControl_position | string | Position of the zoom control. |
streetViewControl_position | string | Position of the Street View control. |
fullscreenControl_position | string | Position of the fullscreen control. |
mapTypeControl_position | string | Position of the map type selector. |
rotateControl_position | string | Position of the rotate/tilt control. |
show_traffic_button_position | string | Position of the traffic layer toggle button |
show_poi_button_position | string | Position of the poi selector button |
show_weather_button_position | string | Position of the weather layer dropdown menu |
show_recenter_button_position | string | Position of the recenter map button |
show_datepicker_button_position | string | Position of the calendar |
show_travel_panel_toggle_button_position | string | Position of the travel panel toggle button |
⚠️ Rotate & Tilt Limitations (Raster Mode)
The rotateControl button in raster mode (default) allows rotating and tilting the map to a 45° perspective view, but it comes with significant Google API constraints that are important to understand.
When it works:
- Map type must be set to
satelliteorhybrid - Zoom level must be 15 or higher
- You must be in a city where Google has captured 45° aerial imagery
Cities with known 45° imagery support (non-exhaustive):
New York, Los Angeles, San Francisco, Chicago, Miami, London, Paris, Berlin, Tokyo, Sydney, Toronto, Amsterdam, Barcelona, Rome, Dubai
When it does NOT work:
map_type: roadmapormap_type: terrain— the button will appear but have no effect- Rural areas, small towns, or regions without 45° Google imagery
- Low zoom levels (below ~15)
Recommended config for best results with raster rotateControl:
yamlmap_type: satellite # or hybrid zoom: 17 rotateControl: true rotateControl_position: LEFT_BOTTOM
💡 For full 360° free rotation on any map type, use
rendering_type: vectorinstead. See below.
🔄 Vector Map & Free Rotation (NEW)
By setting rendering_type: vector, the card switches to Google Maps' WebGL-based vector renderer. This unlocks free 360° rotation and tilt on any map type — including roadmap and terrain — with no Map ID or Google Cloud Console setup required.
What changes in vector mode:
rotateControl: trueenables full drag-to-rotate and pinch-to-tilt gesturescameraControl: trueshows a custom rotate & tilt grid instead of the native pan buttons:
        [ ↑ Decrease Tilt ]
[ ← Rotate ]  [ ⟳ Reset ]  [ → Rotate ]
        [ ↓ Increase Tilt ]
Rotate step: 15° — Tilt step: 10° (range: 0°–67.5°) — ⟳ resets both to 0
- Right-click + drag tilts the map: drag down → more perspective, drag up → flatter. Release without dragging → right-click popup opens normally
theme_modeis not supported — usecolor_schemeinstead (light,dark,follow_system)- The 40+ built-in JSON themes are unavailable (Google API limitation — the
stylesarray only works on raster maps) - Requires a WebGL-capable browser (all modern browsers supported by Home Assistant qualify)
Config example:
yamltype: custom:google-map-card api_key: YOUR_API_KEY rendering_type: vector color_scheme: dark # light | dark | follow_system cameraControl: true # shows rotate/tilt grid in vector mode cameraControl_position: RIGHT_BOTTOM rotateControl: true # enables drag-to-rotate & pinch-to-tilt gestures map_type: roadmap zoom: 15
Raster vs Vector — quick comparison:
| Raster (default) | Vector | |
|---|---|---|
| Free 360° rotation | ❌ | ✅ |
| Rotate/tilt grid control | ❌ | ✅ (via cameraControl) |
| Right-click drag to tilt | ❌ | ✅ |
| 40+ built-in themes | ✅ | ❌ |
| Dark / Light mode | Via themes | color_scheme |
| POI filtering | ✅ | ✅ |
| Traffic layer | ✅ | ✅ |
| Weather layer | ✅ | ✅ |
| GPU / WebGL required | ❌ | ✅ |
⚠️
color_schemecan only be set at map initialization. If you change it, the page must reload to take effect. In Home Assistant, saving the card config triggers a reload automatically.
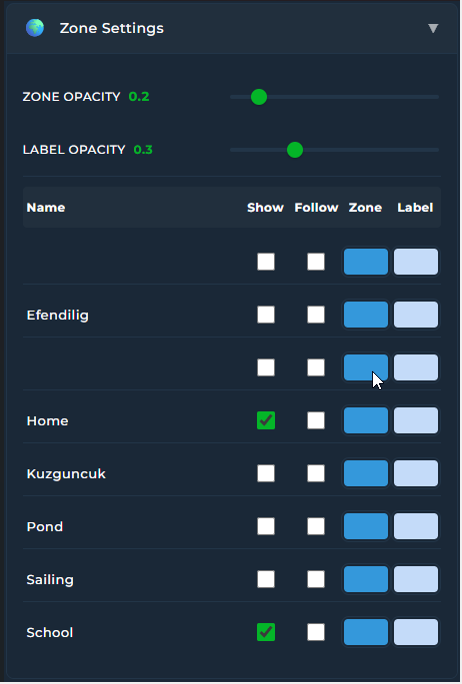
🎯 Zones
| Key | Type | Description |
|---|---|---|
zones | object | Defines zone entities to show on the map, with styling. |
show | boolean | Whether to display the zone or not. |
color | string | Fill color for the zone area (e.g., #3498db). |
zone_opacity | float | Opacity for the zone fill color (0.0 to 1.0). |
zone_label_opacity | float | Opacity for the zone label color (0.0 to 1.0). |
follow | boolean | Centre the map |
🏪 POI
| Key | Type | Description |
|---|---|---|
hide_poi_types: | object | business, attraction, government, medical, park, place_of_worship, school, sports_complex, transit |
🚗 Route Search and Travel Time Calculator
| Key | Type | Description |
|---|---|---|
travel_panel_enabled | boolean | Enable or disable the Route Search and Travel Time Calculator panel. Default: true. |
travel_panel_position | string | Panel position relative to the map: above or below. Default: above. |
show_travel_panel_toggle_button | boolean | Show or hide the toggle button on the map. Default: true. |
show_travel_panel_toggle_button_position | string | Position of the toggle button on the map. Default: LEFT_BOTTOM. |
travel_shortcuts | list | List of predefined route shortcuts for quick calculation. |
travel_shortcuts[].label | string | Display label for the shortcut (e.g., "Go to Work"). |
travel_shortcuts[].icon | string | MDI icon for the shortcut button (e.g., "mdi:office-building"). |
travel_shortcuts[].from_entity | string | Source entity ID (person.*, device_tracker.*, or zone.*). |
travel_shortcuts[].to_entity | string | Destination entity ID (person.*, device_tracker.*, or zone.*). |
The following control positions are supported:
TOP_LEFT, TOP_CENTER, TOP_RIGHT,
LEFT_TOP, LEFT_CENTER, LEFT_BOTTOM,
RIGHT_TOP, RIGHT_CENTER, RIGHT_BOTTOM,
BOTTOM_LEFT, BOTTOM_CENTER, BOTTOM_RIGHT
| Position | Description |
|---|---|
TOP_CENTER | Control placed along the top center of the map. |
TOP_LEFT | Control placed along the top left of the map, with sub-elements “flowing” toward the top center. |
TOP_RIGHT | Control placed along the top right of the map, with sub-elements “flowing” toward the top center. |
LEFT_TOP | Control placed along the top left of the map, but below any TOP_LEFT elements. |
RIGHT_TOP | Control placed along the top right of the map, but below any TOP_RIGHT elements. |
LEFT_CENTER | Control placed along the left side of the map, centered between TOP_LEFT and BOTTOM_LEFT. |
RIGHT_CENTER | Control placed along the right side of the map, centered between TOP_RIGHT and BOTTOM_RIGHT. |
LEFT_BOTTOM | Control placed along the bottom left of the map, but above any BOTTOM_LEFT elements. |
RIGHT_BOTTOM | Control placed along the bottom right of the map, but above any BOTTOM_RIGHT elements. |
BOTTOM_CENTER | Control placed along the bottom center of the map. |
BOTTOM_LEFT | Control placed along the bottom left of the map, with sub-elements “flowing” toward the bottom center. |
BOTTOM_RIGHT | Control placed along the bottom right of the map, with sub-elements “flowing” toward the bottom center. |
Card Example
yamltype: custom:google-map-card api_key: <<GOOGLE API KEY>> owm_api_key: <<OPEN WEATHER API KEY>> theme_mode: Dark_Blueish_Night map_type: roadmap zoom: 16 aspect_ratio: 1.53:1 weather_layer: clouds_new weather_layer_opacity: 0.5 proximity_clustering: true proximity_radius: 5 marker_clustering: false spiderfy: true gesture_handling: greedy camera_control: false zoom_control: false zoom_control_position: RIGHT_BOTTOM street_view_control: false street_view_control_position: LEFT_BOTTOM fullscreen_control: false fullscreen_control_position: RIGHT_TOP map_type_control: false map_type_control_position: TOP_LEFT map_type_control_style: DROPDOWN_MENU rotate_control: false pan_control: true show_scale: false scaleControlPosition: BOTTOM_LEFT keyboard_shortcuts: false show_traffic_button: true show_traffic_button_position: TOP_RIGHT show_weather_button: true show_weather_button_position: TOP_RIGHT show_recenter_button: true show_recenter_button_position: LEFT_BOTTOM show_datepicker_button: true show_datepicker_button_position: TOP_CENTER show_traffic: false show_history_dots: true travel_panel_enabled: true travel_panel_position: below show_travel_panel_toggle_button: true show_travel_panel_toggle_button_position: LEFT_BOTTOM travel_shortcuts: - label: "Go to Work" icon: "mdi:office-building" from_entity: "person.cenk" to_entity: "zone.work" - label: "Go Home" icon: "mdi:home" from_entity: "person.cenk" to_entity: "zone.home" zones: zone.work: show: false color: "#3498db" follow: false label_color: "#c4dbf9" zone.work_2: show: false color: "#3498db" follow: false label_color: "#c4dbf9" zone.home: show: true color: "#3498db" follow: false label_color: "#c4dbf9" # Date range (card-level) — applies to all entities with use_date_range: true # Option A: Use a preset (recalculated on every page load) history_preset: today # today | yesterday | last7 | last15 # Option B: Use a fixed date range # history_preset: null # history_start_date: "2026-02-20T21:00:00.000Z" # history_end_date: "2026-02-21T20:55:00.000Z" entities: - entity: device_tracker.flightradar24 icon_size: 30 hours_to_show: 10 polyline_color: "#ffffff" polyline_width: 1 icon_color: "#780202" background_color: "#ffffff" - entity: person.cenk icon_size: 30 hours_to_show: 0 use_date_range: true polyline_color: "#ffffff" polyline_width: 1 icon_color: "#780202" background_color: "#ffffff" history_dot_shape: diamond show_gps_accuracy_radius_line: true gps_accuracy_ranges: - min: 0 max: 15 label: Excellent (0-15m) color: "#15cb1b" opacity: 0.6 - min: 16 max: 100 label: Good (16-100m) color: "#0dccf2" opacity: 1 - min: 101 max: 250 label: Fair (101-250m) color: "#ffeb3b" opacity: 1 - min: 251 max: 500 label: Poor (251-500m) color: "#ff9800" opacity: 1 - min: 501 max: 99999 label: Very Poor (501m+) color: "#f44336" opacity: 1 - entity: person.derya icon_size: 30 hours_to_show: 0 use_date_range: true polyline_color: "#ffffff" polyline_width: 1 icon_color: "#780202" background_color: "#ffffff" history_dot_shape: triangle history_dot_filled: false
⭐ Support
If you like this card, feel free to ⭐ star the project on GitHub and share it with the Home Assistant community or buy me a coffee!
<a href="https://www.buymeacoffee.com/cataseven" target="_blank"> <img src="https://cdn.buymeacoffee.com/buttons/v2/default-yellow.png" alt="Buy Me a Coffee" style="height: 60px !important;width: 217px !important;" > </a>Star History
Contributors
Showing top 1 contributor by commit count.
