Volatility trading
A complete set of volatility estimators based on Euan Sinclair's Volatility Trading
[Getting Started With Python for Quant Finance](https://gettingstartedwithpythonforquantfinance.com) is the cohort-based course and community that will take you from complete beginner to up and running with Python for quant finance in 30 days. The project is written primarily in Python, distributed under the GNU General Public License v3.0 license, first published in 2014. It has gained significant community traction with 1,927 stars and 404 forks on GitHub. Key topics include: options, options-trading, python, trading, volatility.
volest
Learn how to apply this code to your own options trading
Getting Started With Python for Quant Finance is the cohort-based course and community that will take you from complete beginner to up and running with Python for quant finance in 30 days.
A complete set of volatility estimators based on Euan Sinclair's Volatility Trading
The original version incorporated network data acquisition from Yahoo!Finance
from pandas_datareader. Yahoo! changed their API and broke pandas_datareader.
The changes allow you to specify your own data so you're not tied into equity
data from Yahoo! finance. If you're still using equity data, just download
a CSV from finance.yahoo.com and use the data.yahoo_data_helper method
to form the data properly.
Volatility estimators include:
- Garman Klass
- Hodges Tompkins
- Parkinson
- Rogers Satchell
- Yang Zhang
- Standard Deviation
Also includes
- Skew
- Kurtosis
- Correlation
For each of the estimators, plot:
- Probability cones
- Rolling quantiles
- Rolling extremes
- Rolling descriptive statistics
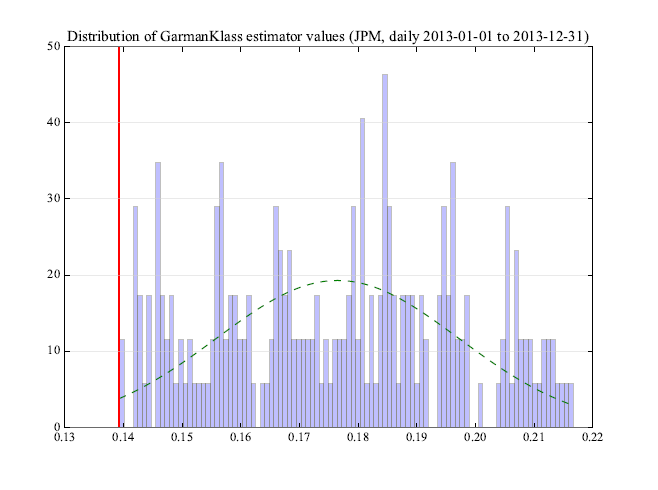
- Histogram
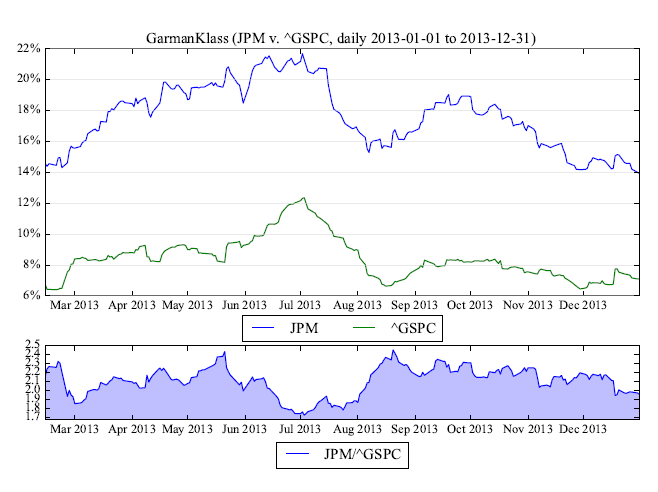
- Comparison against arbirary comparable
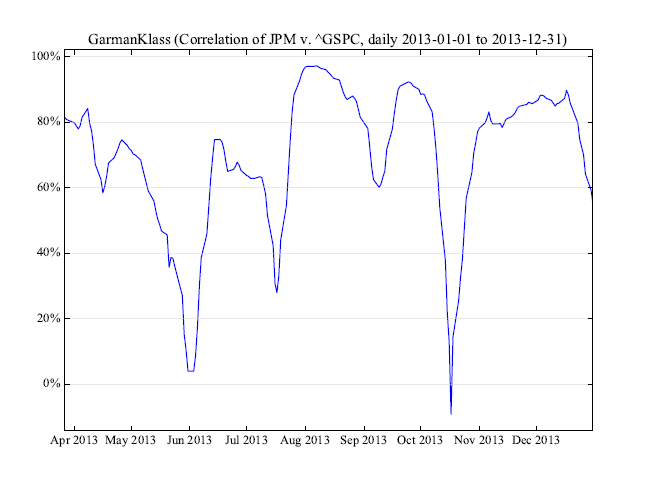
- Correlation against arbirary comparable
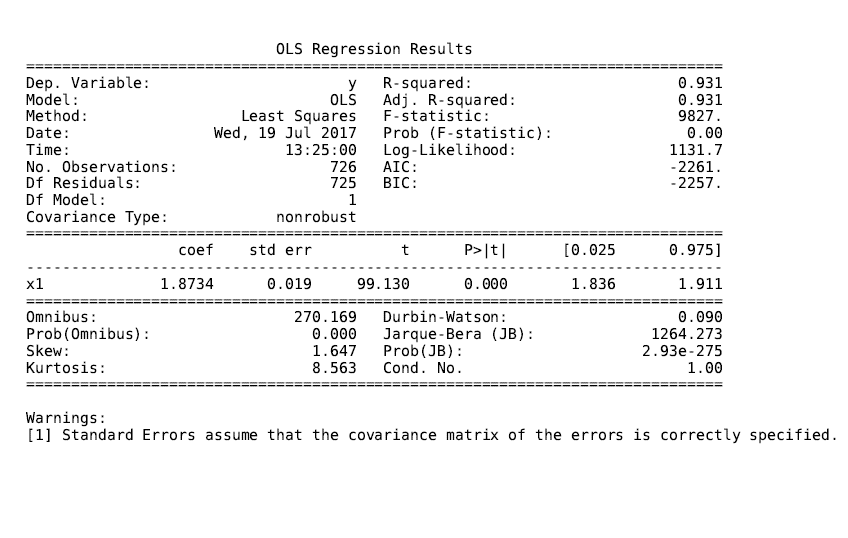
- Regression against arbirary comparable
Create a term sheet with all the metrics printed to a PDF.
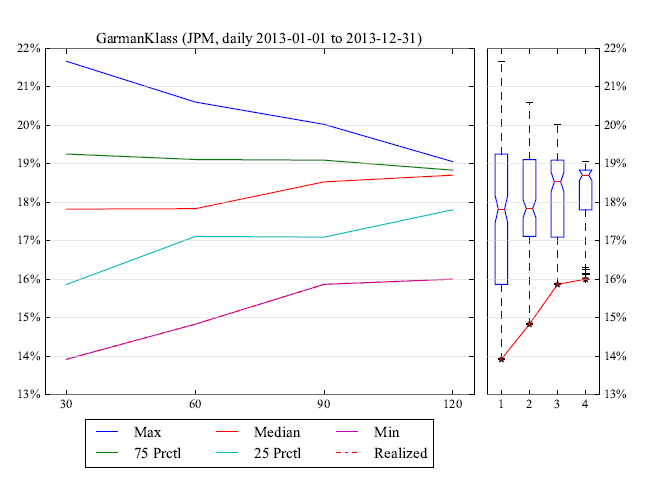
Page 1 - Volatility cones
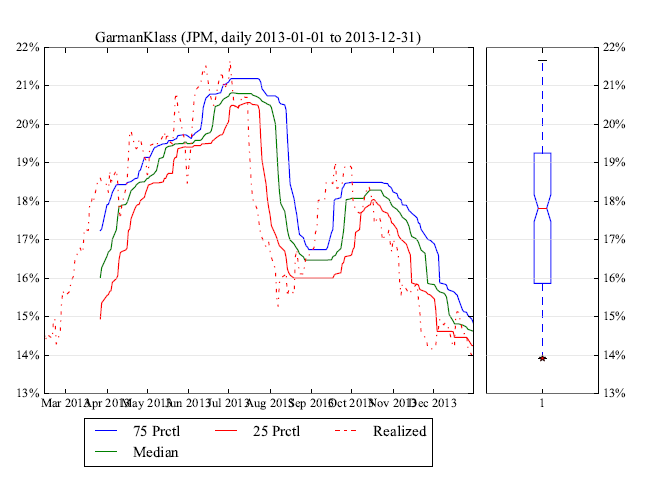
Page 2 - Volatility rolling percentiles
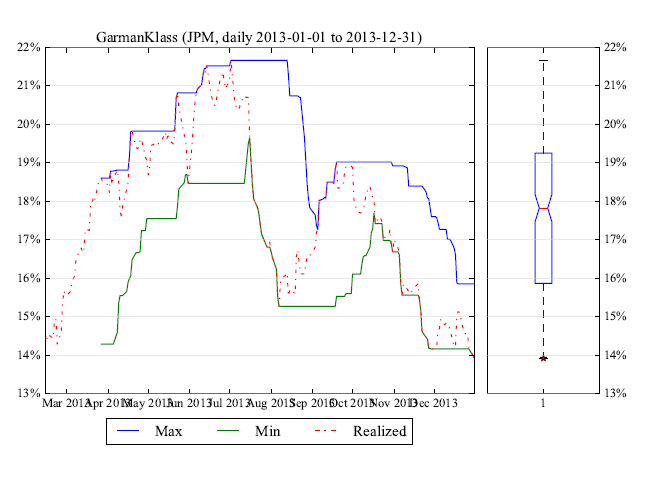
Page 3 - Volatility rolling min and max
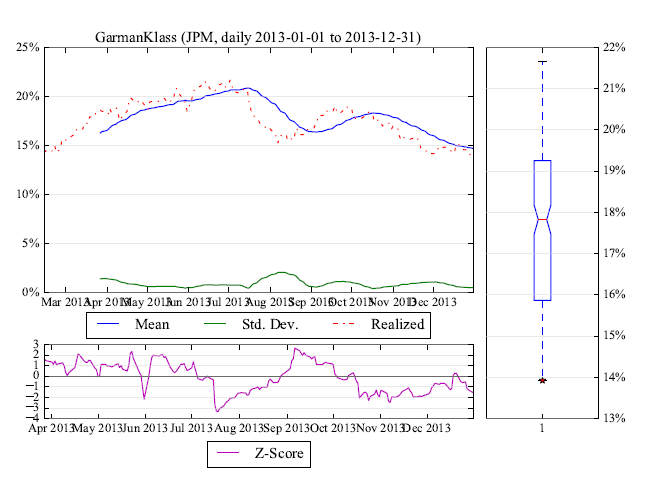
Page 4 - Volatility rolling mean, standard deviation and zscore
Page 5 - Volatility distribution
Page 6 - Volatility, benchmark volatility and ratio###
Page 7 - Volatility rolling correlation with benchmark
Page 3 - Volatility OLS results
Example usage:
pythonfrom volatility import volest import yfinance as yf # data symbol = 'JPM' bench = 'SPY' estimator = 'GarmanKlass' # estimator windows window = 30 windows = [30, 60, 90, 120] quantiles = [0.25, 0.75] bins = 100 normed = True # use the yahoo helper to correctly format data from finance.yahoo.com jpm_price_data = yf.Ticker(symbol).history(period="5y") jpm_price_data.symbol = symbol spx_price_data = yf.Ticker(bench).history(period="5y") spx_price_data.symbol = bench # initialize class vol = volest.VolatilityEstimator( price_data=jpm_price_data, estimator=estimator, bench_data=spx_price_data ) # call plt.show() on any of the below... _, plt = vol.cones(windows=windows, quantiles=quantiles) _, plt = vol.rolling_quantiles(window=window, quantiles=quantiles) _, plt = vol.rolling_extremes(window=window) _, plt = vol.rolling_descriptives(window=window) _, plt = vol.histogram(window=window, bins=bins, normed=normed) _, plt = vol.benchmark_compare(window=window) _, plt = vol.benchmark_correlation(window=window) # ... or create a pdf term sheet with all metrics in term-sheets/ vol.term_sheet( window, windows, quantiles, bins, normed )
Hit me on twitter with comments, questions, issues @jasonstrimpel
Contributors
Showing top 5 contributors by commit count.


Related Repositories

OpenBB-finance/OpenBB
Financial data platform for analysts, quants and AI agents.

QuantConnect/Lean
Lean Algorithmic Trading Engine by QuantConnect (Python, C#)

Choices-js/Choices
A vanilla JS customisable select box/text input plugin ⚡️

JerBouma/FinanceToolkit
Transparent and Efficient Financial Analysis

symfony/options-resolver
Provides an improved replacement for the array_replace PHP function

openctp/openctp
openctp提供CTP股票期权、中泰证券XTP、华鑫证券奇点TORA、东方证券OST、东方财富证券EMT、盈透证券TWS、易盛TAP、量投QDP等各通道的CTPAPI兼容接口,CTP程序可以无缝对接各股票柜台。openctp也提供了一套基于TTS交易系统的模拟环境,同样提供了CTPAPI兼容接口,不仅支持国内期货与期权全品种,也支持A股股票、基金、债券以及股票期权模拟交易,可以替代Simnow,为CTP量化交易开发者提供7x24可用的模拟环境。