Py factorgraph
Factor graphs and loopy belief propagation implemented in Python
This is a tiny python library that allows you to build factor graphs and run the (loopy) belief propagation algorithm with ease. It depends only on [`numpy`](http://www.numpy.org/). The project is written primarily in Python, distributed under the MIT License license, first published in 2016. Key topics include: factor, factor-graph, graph, lbp, loopy-belief-propagation.
py-factorgraph
![]()
![]()
![]()
This is a tiny python library that allows you to build factor graphs and run
the (loopy) belief propagation algorithm with ease. It depends only on
numpy.
Installation
bashpip install factorgraph
Example
Code (found in examples/simplegraph.py)
pythonimport numpy as np import factorgraph as fg # Make an empty graph g = fg.Graph() # Add some discrete random variables (RVs) g.rv('a', 2) g.rv('b', 3) # Add some factors, unary and binary g.factor(['a'], potential=np.array([0.3, 0.7])) g.factor(['b', 'a'], potential=np.array([ [0.2, 0.8], [0.4, 0.6], [0.1, 0.9], ])) # Run (loopy) belief propagation (LBP) iters, converged = g.lbp(normalize=True) print('LBP ran for %d iterations. Converged = %r' % (iters, converged)) print() # Print out the final messages from LBP g.print_messages() print() # Print out the final marginals g.print_rv_marginals(normalize=True)
Run with python -m examples.simplegraph. Output:
LBP ran for 3 iterations. Converged = True

Current outgoing messages:
	b -> f(b, a) 	[ 0.33333333  0.33333333  0.33333333]
	f(a) -> a 	[ 0.3  0.7]
	a -> f(a) 	[ 0.23333333  0.76666667]
	a -> f(b, a) 	[ 0.3  0.7]
	f(b, a) -> b 	[ 0.34065934  0.2967033   0.36263736]
	f(b, a) -> a 	[ 0.23333333  0.76666667]

Marginals for RVs (normalized):
a
	 0 	 0.11538461538461539
	 1 	 0.8846153846153845
b
	 0 	 0.34065934065934067
	 1 	 0.29670329670329676
	 2 	 0.3626373626373626
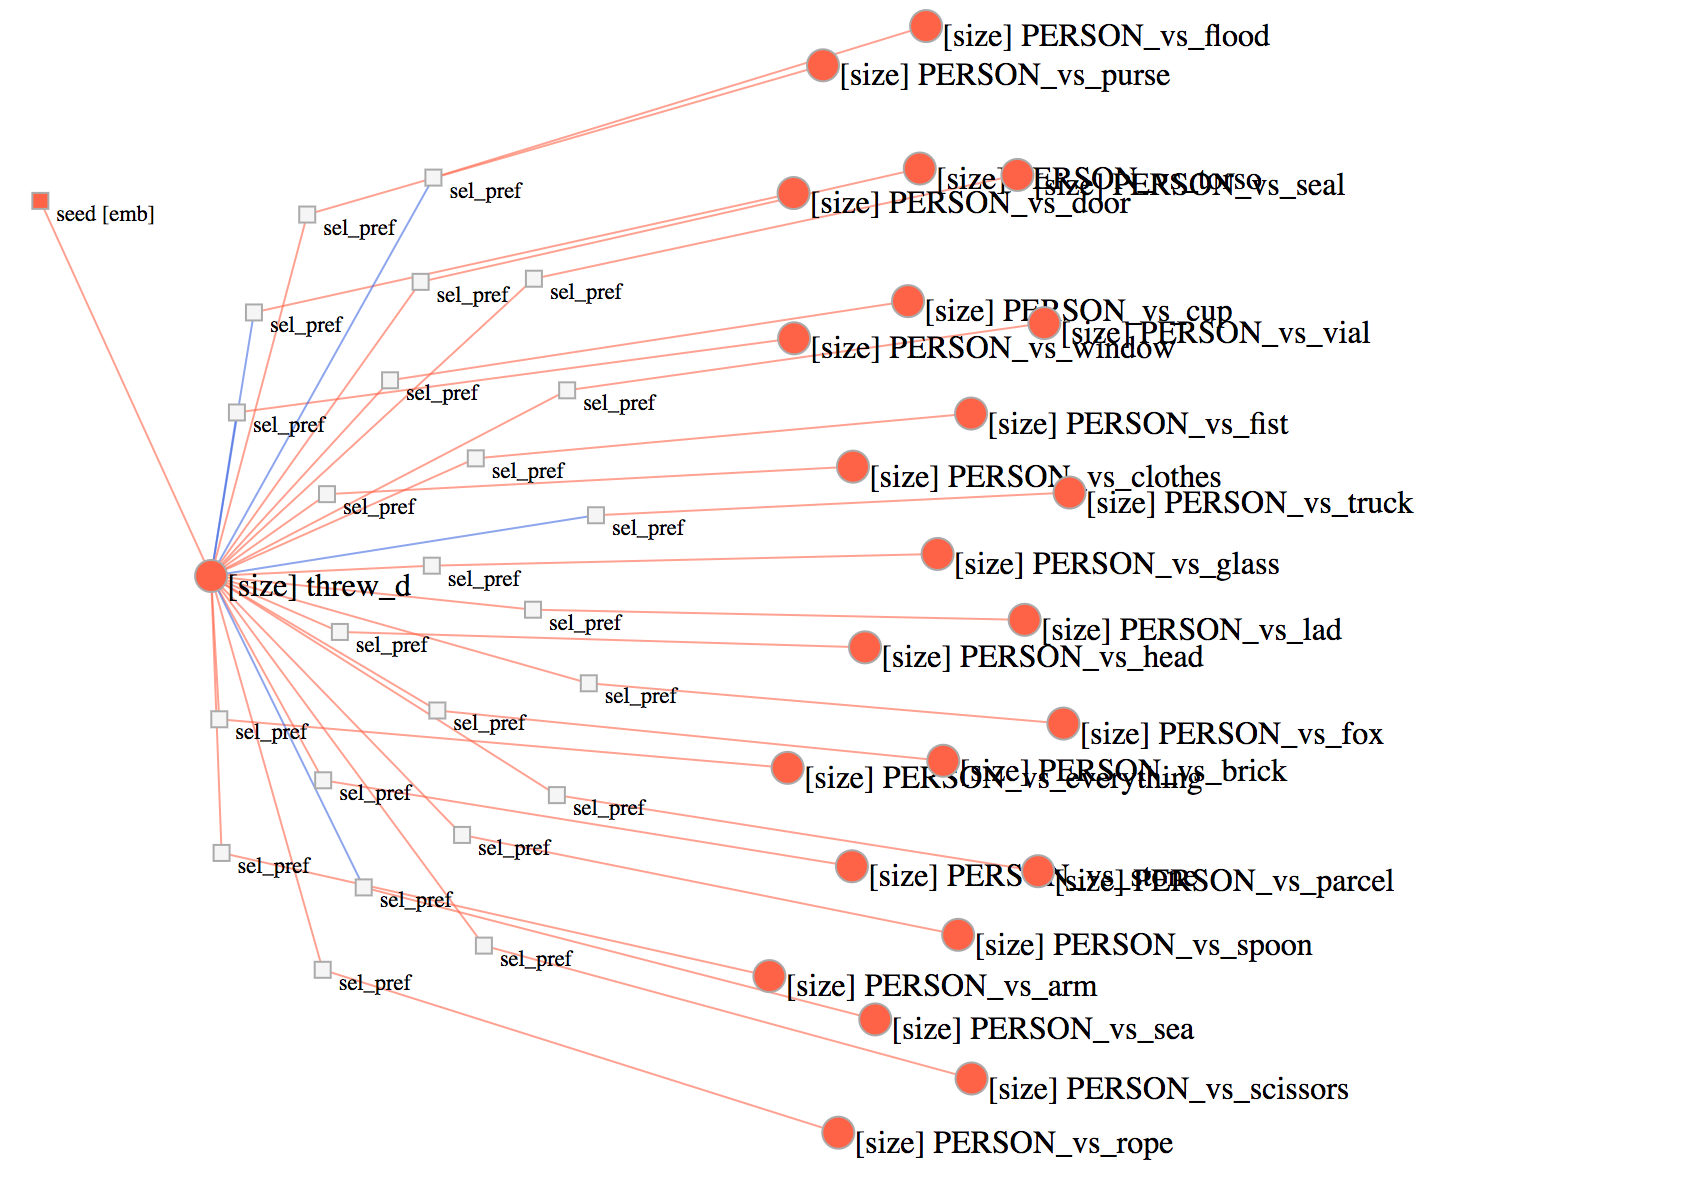
Visualization
You can use factorgraph-viz to
visualize factor graphs interactively in your web browser.
Tests
bashpip install pytest-cov coveralls py.test --cov=factorgraph tests/
Projects using py-factorgraph
Open an issue or send a PR if you'd like your project listed here.
Contributing
There's plenty of low-hanging fruit to work on if you'd like to contribute to
this project. Here are some ideas:
- Unit tests
- Auto-generated python docs (what's popular these days?)
- Performance: measure bottlenecks and improve them (ideas: numba;
parallelization for large graphs;) - Remove or improve ctrl-C catching (the
E_STOP) - Cleaning up the API (essentially duplicate constructors for
RVs and
Factors within theGraphcode; probably should have a node superclass for
RVs andFactors that pulls out common code).
Releasing
Notes for myself on how to release new versions:
bash# Bump version in setup.py. Then, python setup.py sdist pip install twine twine upload dist/*
Thanks
-
to Matthew R. Gormley and Jason Eisner for the Structured Belief Propagation
for NLP Tutorial, which was
extremely helpful for me in learning about factor graphs and understanding
the sum product algorithm. -
to Ryan Lester for pyfac, whose tests I
used directly to test my implementation
Contributors
Showing top 2 contributors by commit count.


Related Repositories

factor/factor
Factor programming language

raivo-otp/ios-application
A native, lightweight and secure one-time-password (OTP) client built for iOS; Raivo OTP!

refaktor/rye
Programming and interaction language. Flexible about syntax, strict about state.

tidyverse/forcats
🐈🐈🐈🐈: tools for working with categorical variables (factors)

sergiocorreia/ftools
Fast Stata commands for large datasets

ladjs/dotenv-parse-variables
Parse dotenv files for Boolean, Array, and Number variable types, built for Lad