Kalibr allan
IMU Allan standard deviation charts for use with Kalibr and inertial kalman filters.
This has some nice utility scripts and packages that allow for calculation of the noise values for use in both [kalibr](https://github.com/ethz-asl/kalibr) and IMU filters. The dataset of the manufacture can find the "white noise" values for the system, but the bias noises need to be found through experimental tests. The `gyroscope_random_walk` and `accelerometer_random_walk` values can normally be found on the IMU datasheet as either angular random walk or velocity random walk, respectively. The project is written primarily in MATLAB, first published in 2017. Key topics include: allan-variance, calibration, imu, imu-noise, kalibr.
kalibr_allan
This has some nice utility scripts and packages that allow for calculation of the noise values for use in both kalibr and IMU filters.
The dataset of the manufacture can find the "white noise" values for the system, but the bias noises need to be found through experimental tests.
The gyroscope_random_walk and accelerometer_random_walk values can normally be found on the IMU datasheet as either angular random walk or velocity random walk, respectively.
IMU Noise Values
| Parameter | YAML element | Symbol | Units |
|---|---|---|---|
| Gyroscope "white noise" | gyroscope_noise_density | <img src="https://latex.codecogs.com/svg.latex?{%5Csigma_g}"> | <img src="https://latex.codecogs.com/svg.latex?{%5Cfrac%7Brad%7D%7Bs%7D%5Cfrac%7B1%7D%7B%5Csqrt%7BHz%7D%7D}"> |
| Accelerometer "white noise" | accelerometer_noise_density | <img src="https://latex.codecogs.com/svg.latex?{%5Csigma_a}"> | <img src="https://latex.codecogs.com/svg.latex?{%5Cfrac%7Bm%7D%7Bs^2%7D%5Cfrac%7B1%7D%7B%5Csqrt%7BHz%7D%7D}"> |
| Gyroscope "random walk" | gyroscope_random_walk | <img src="https://latex.codecogs.com/svg.latex?{%5Csigma_b_g}"> | <img src="https://latex.codecogs.com/svg.latex?{%5Cfrac%7Brad%7D%7Bs^2%7D%5Cfrac%7B1%7D%7B%5Csqrt%7BHz%7D%7D}"> |
| Accelerometer "random walk" | accelerometer_random_walk | <img src="https://latex.codecogs.com/svg.latex?{%5Csigma_b_a}"> | <img src="https://latex.codecogs.com/svg.latex?{%5Cfrac%7Bm%7D%7Bs^3%7D%5Cfrac%7B1%7D%7B%5Csqrt%7BHz%7D%7D}"> |
Experiment Steps
- With the IMU remaining still, record a ROS bag of the readings (we collected a bag for about 4 hours)
- Convert the ROS bag into a matlab mat file.
- Use the included
bagconvertROS package to do this - Example:
rosrun bagconvert bagconvert imu.bag /imu0
- Use the included
- Run the included matlab scripts to generate an allan deviation plot for the readings
- If using the parallel version, it uses the matlab parallel toolbox
- Need to specify the mat file that the bagconverter made, and the rate of IMU messages
- Interpret the generated charts to find noise values
- Run the process results script
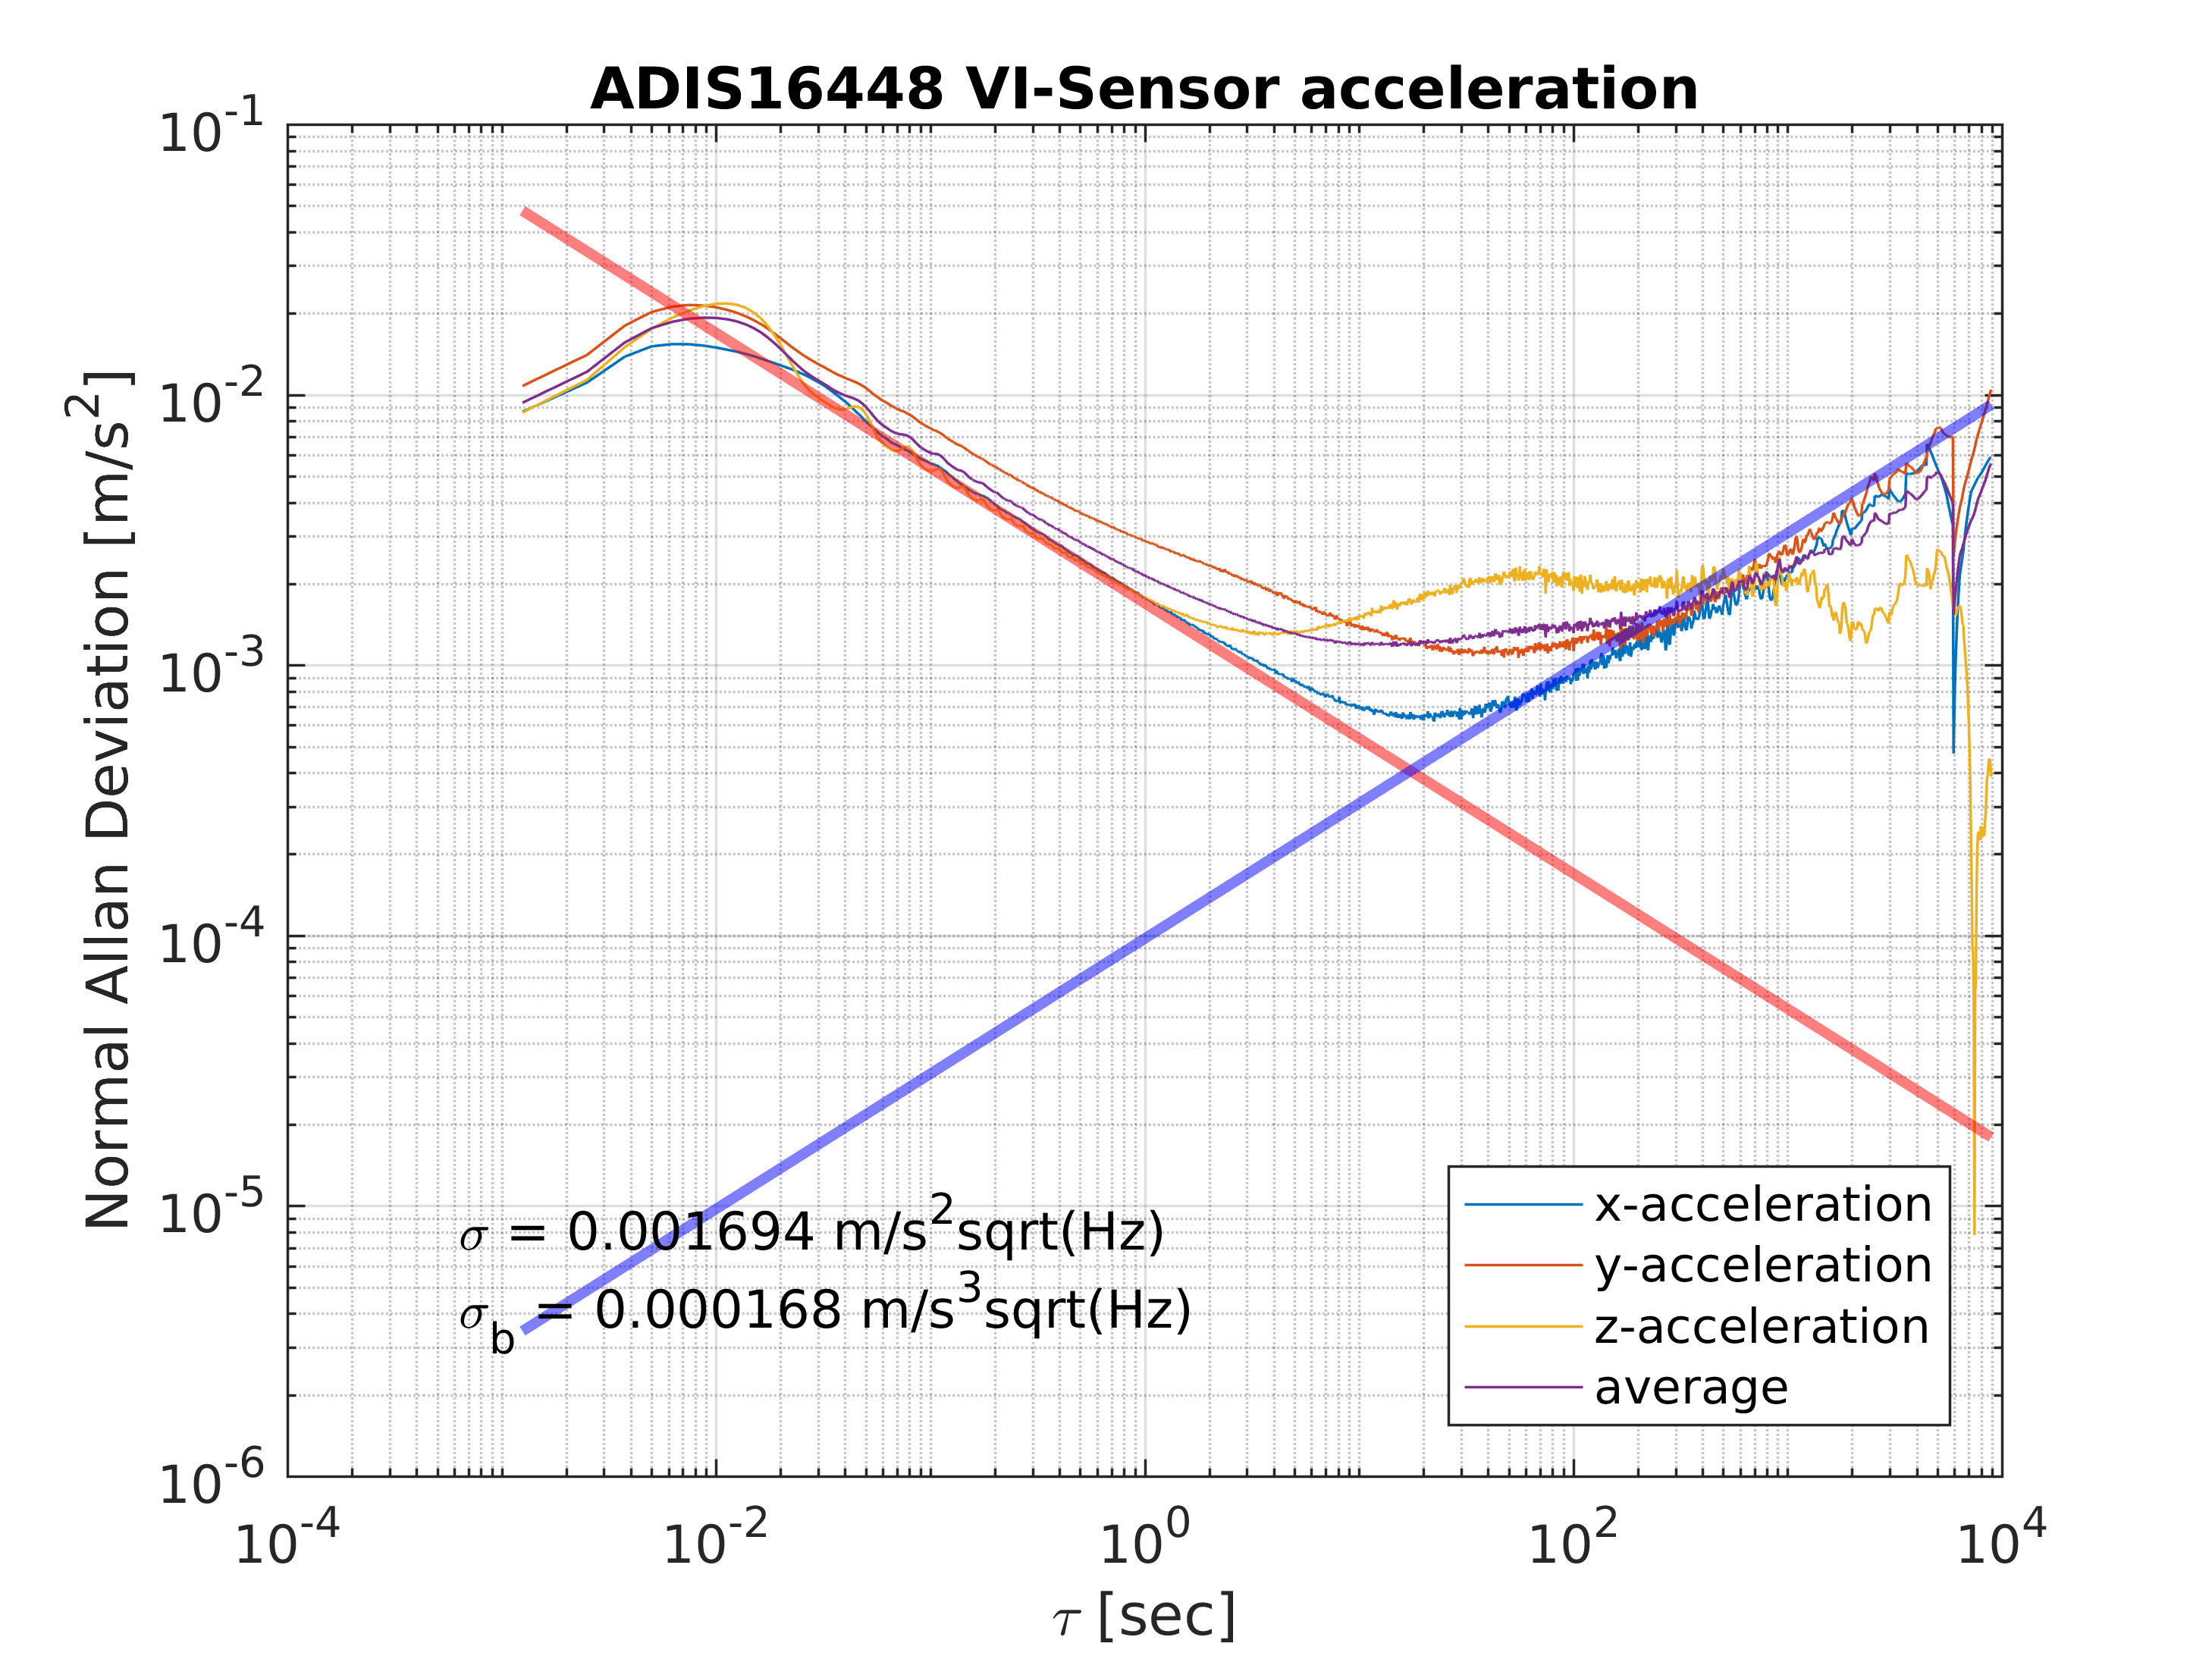
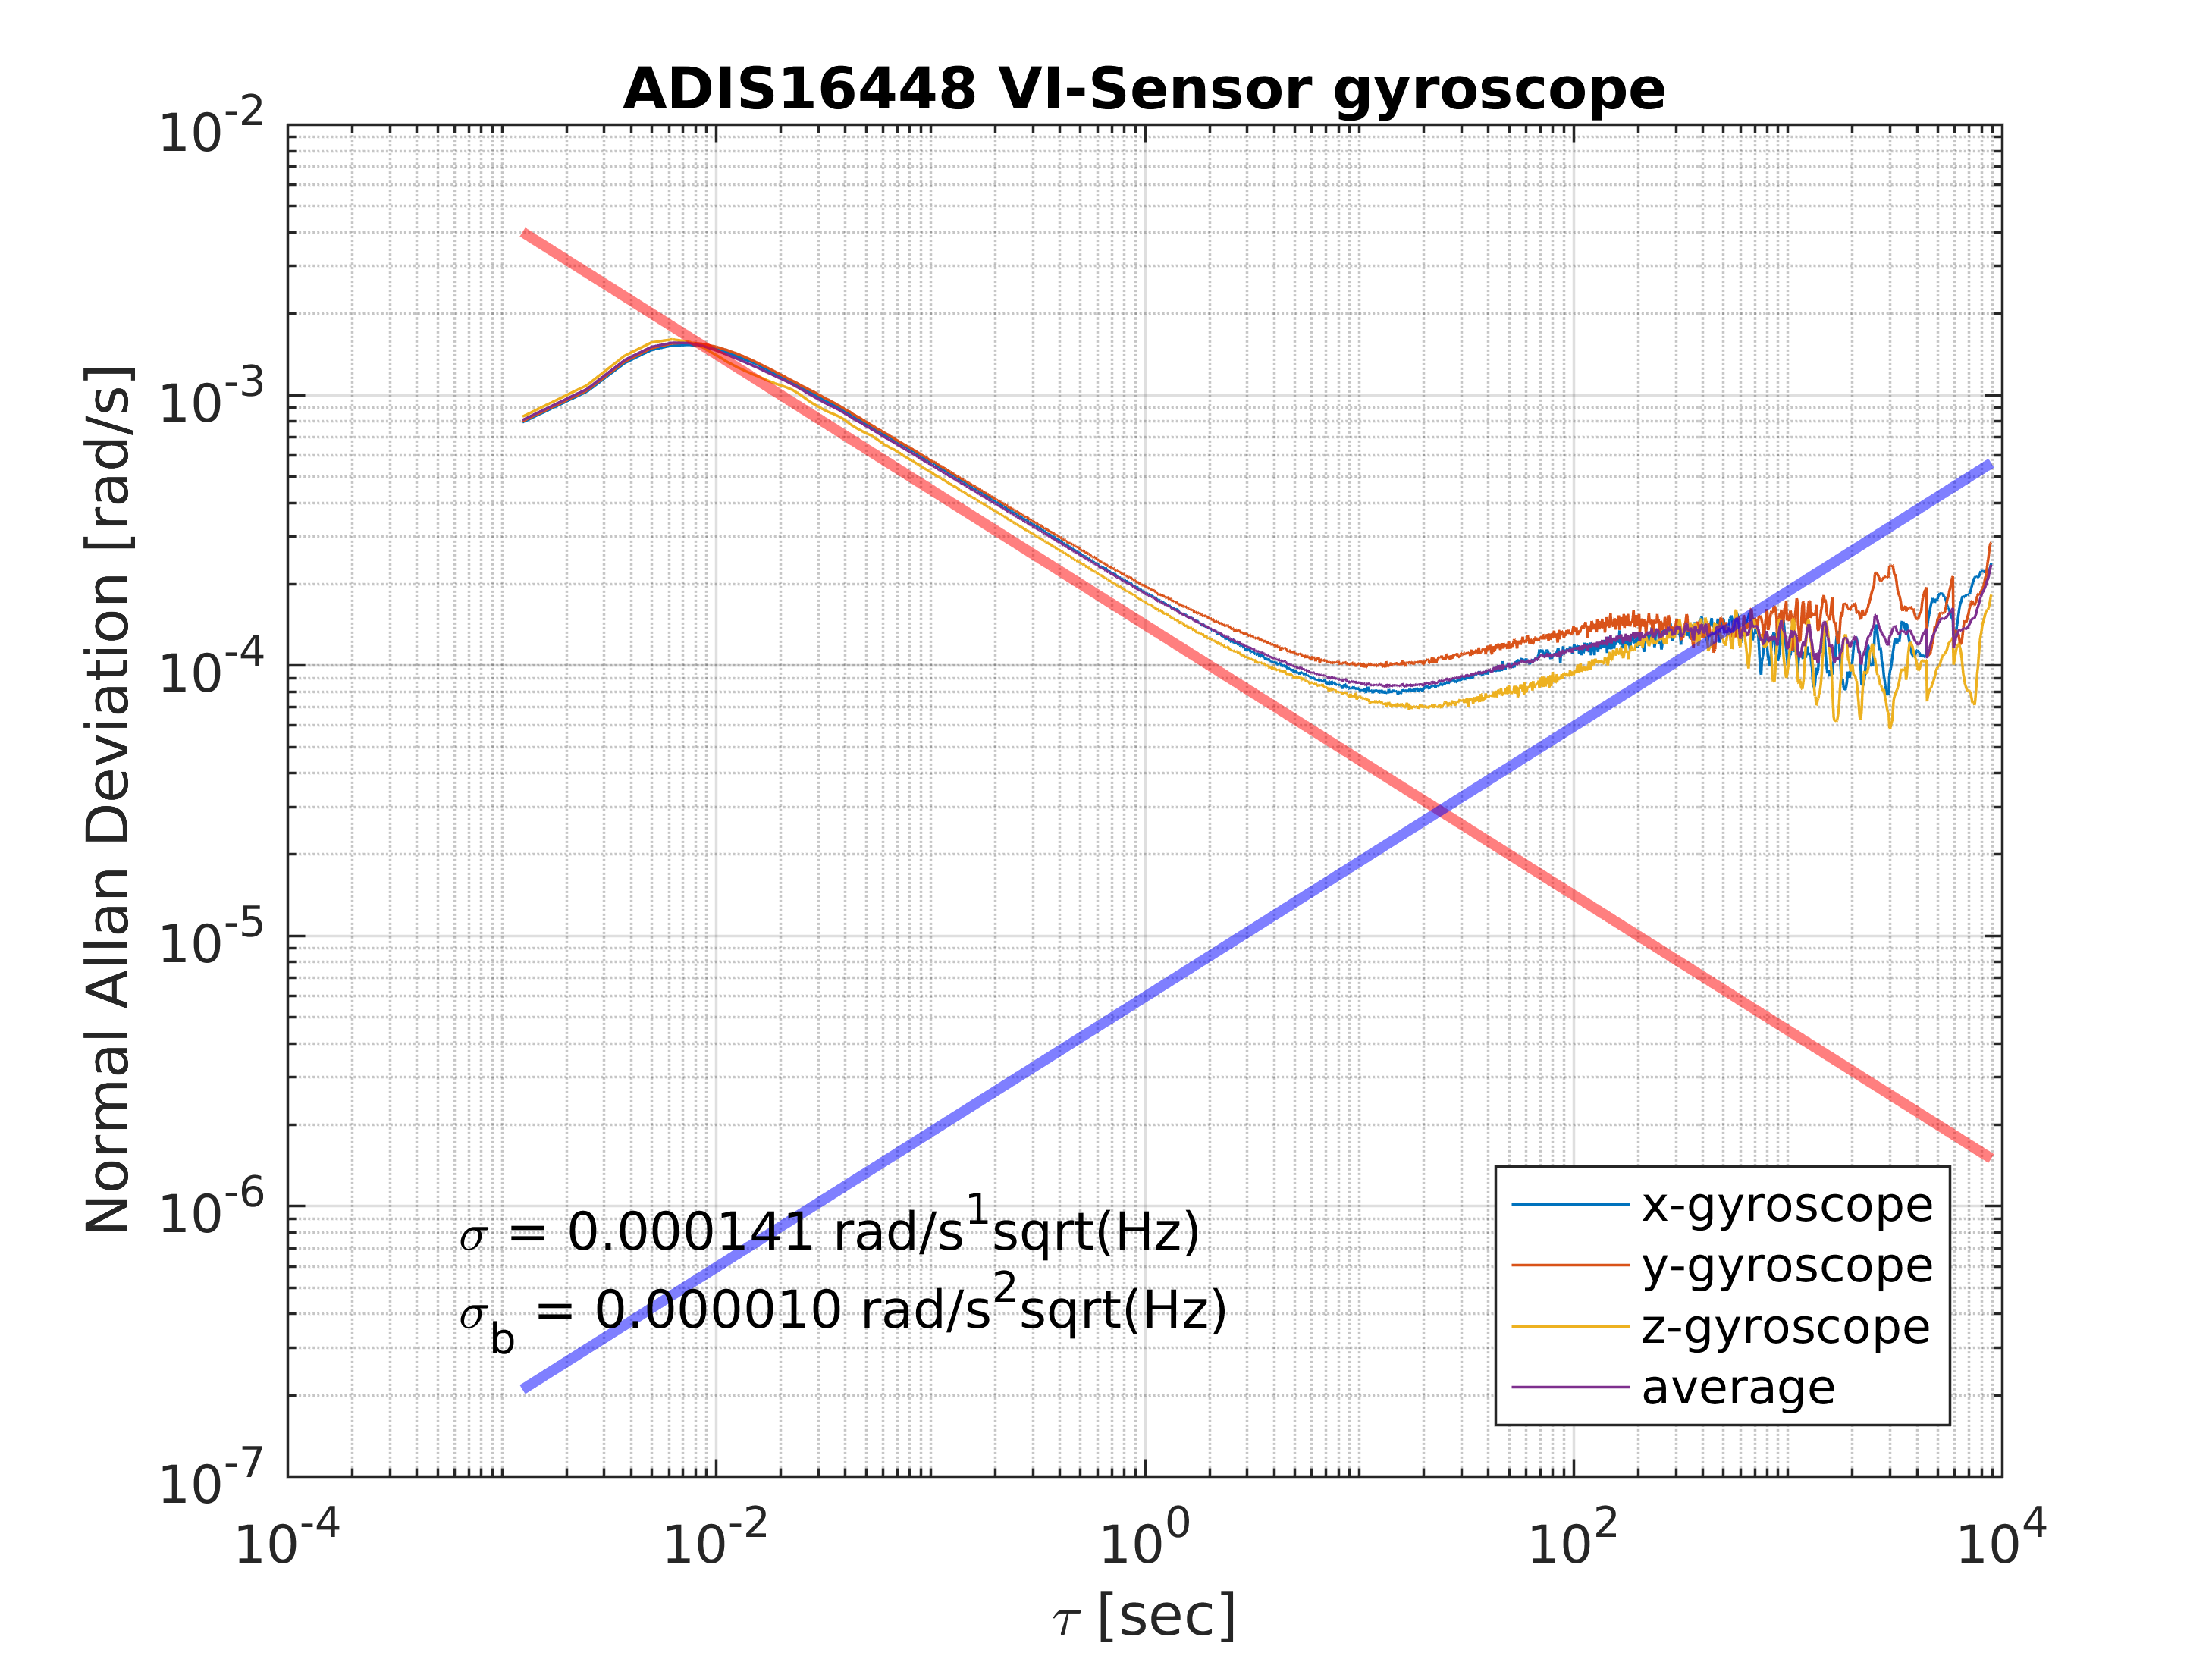
- Will fit a -1/2 line to the left side of the allan plot
- White noise is at tau=1 (according to kalibr wiki)
- Will fit a 1/2 line to the right side of the allan plot
- Random walk is at tau=3 (according to kalibr wiki)
- Some example data can be found HERE:
- XSENS MTI-G-700
- Tango Yellowstone Tablet
- ASL-ETH VI-Sensor
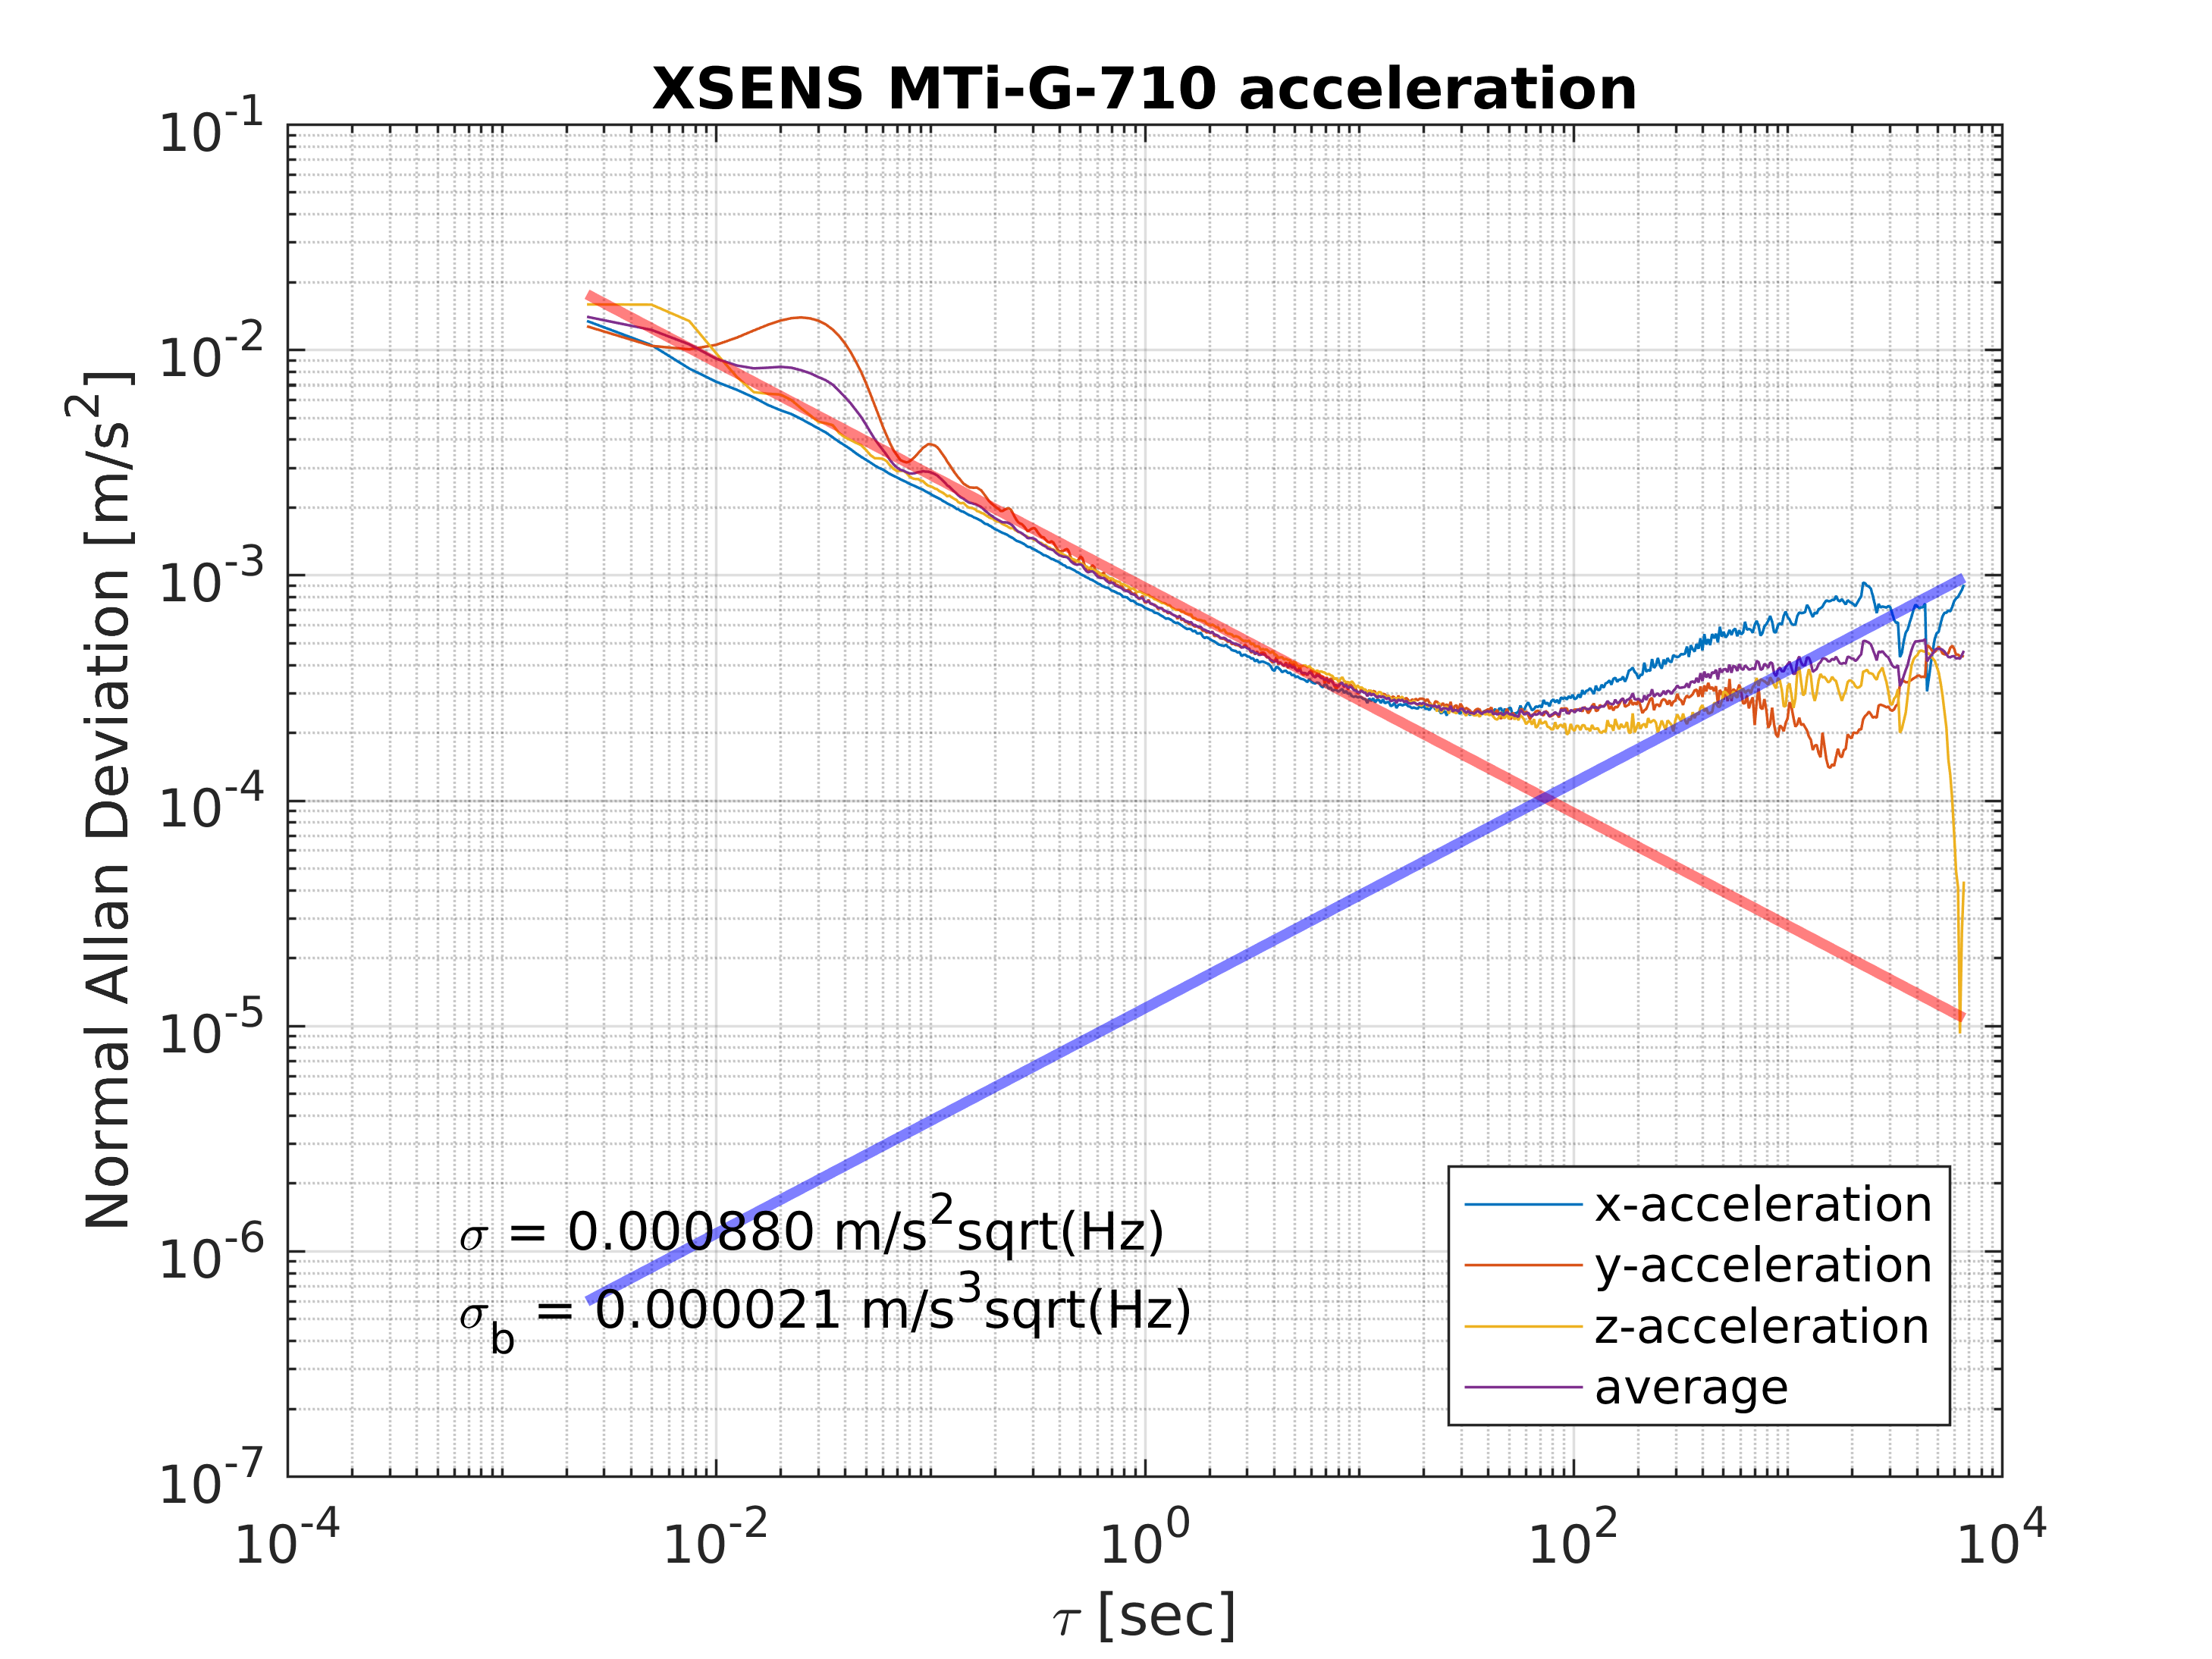
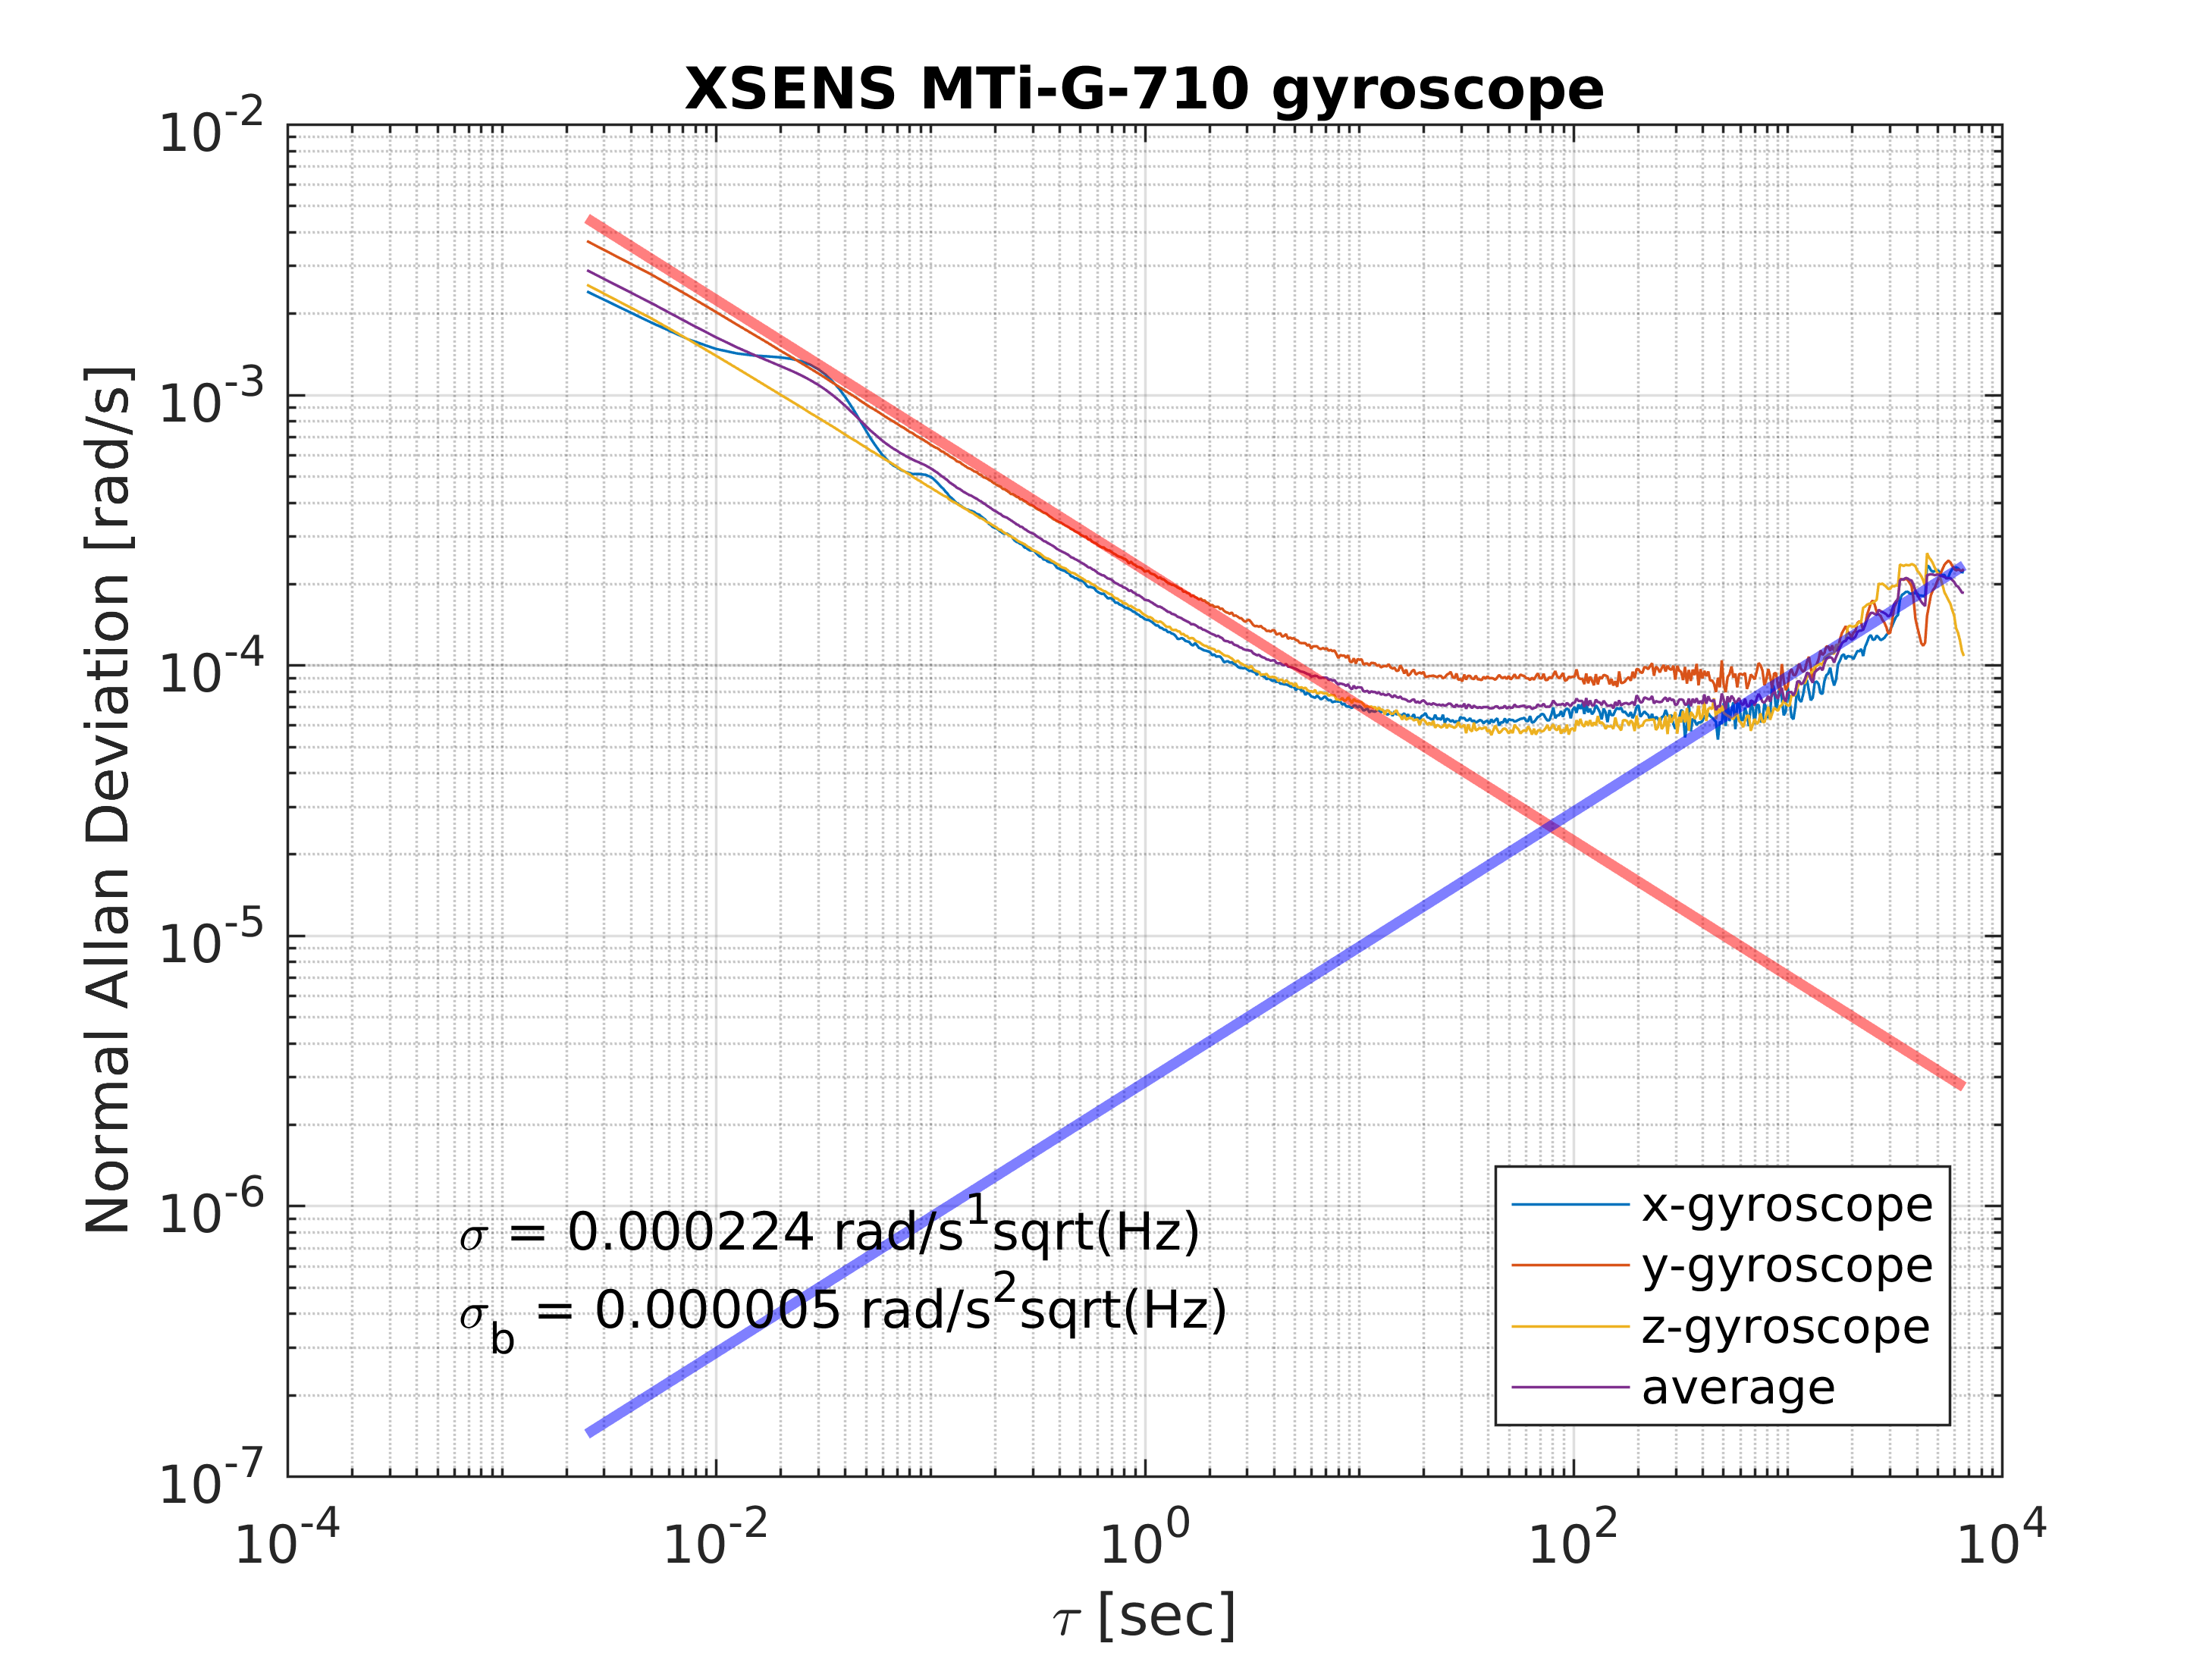
Example Plot - XSENS MTI-G-700
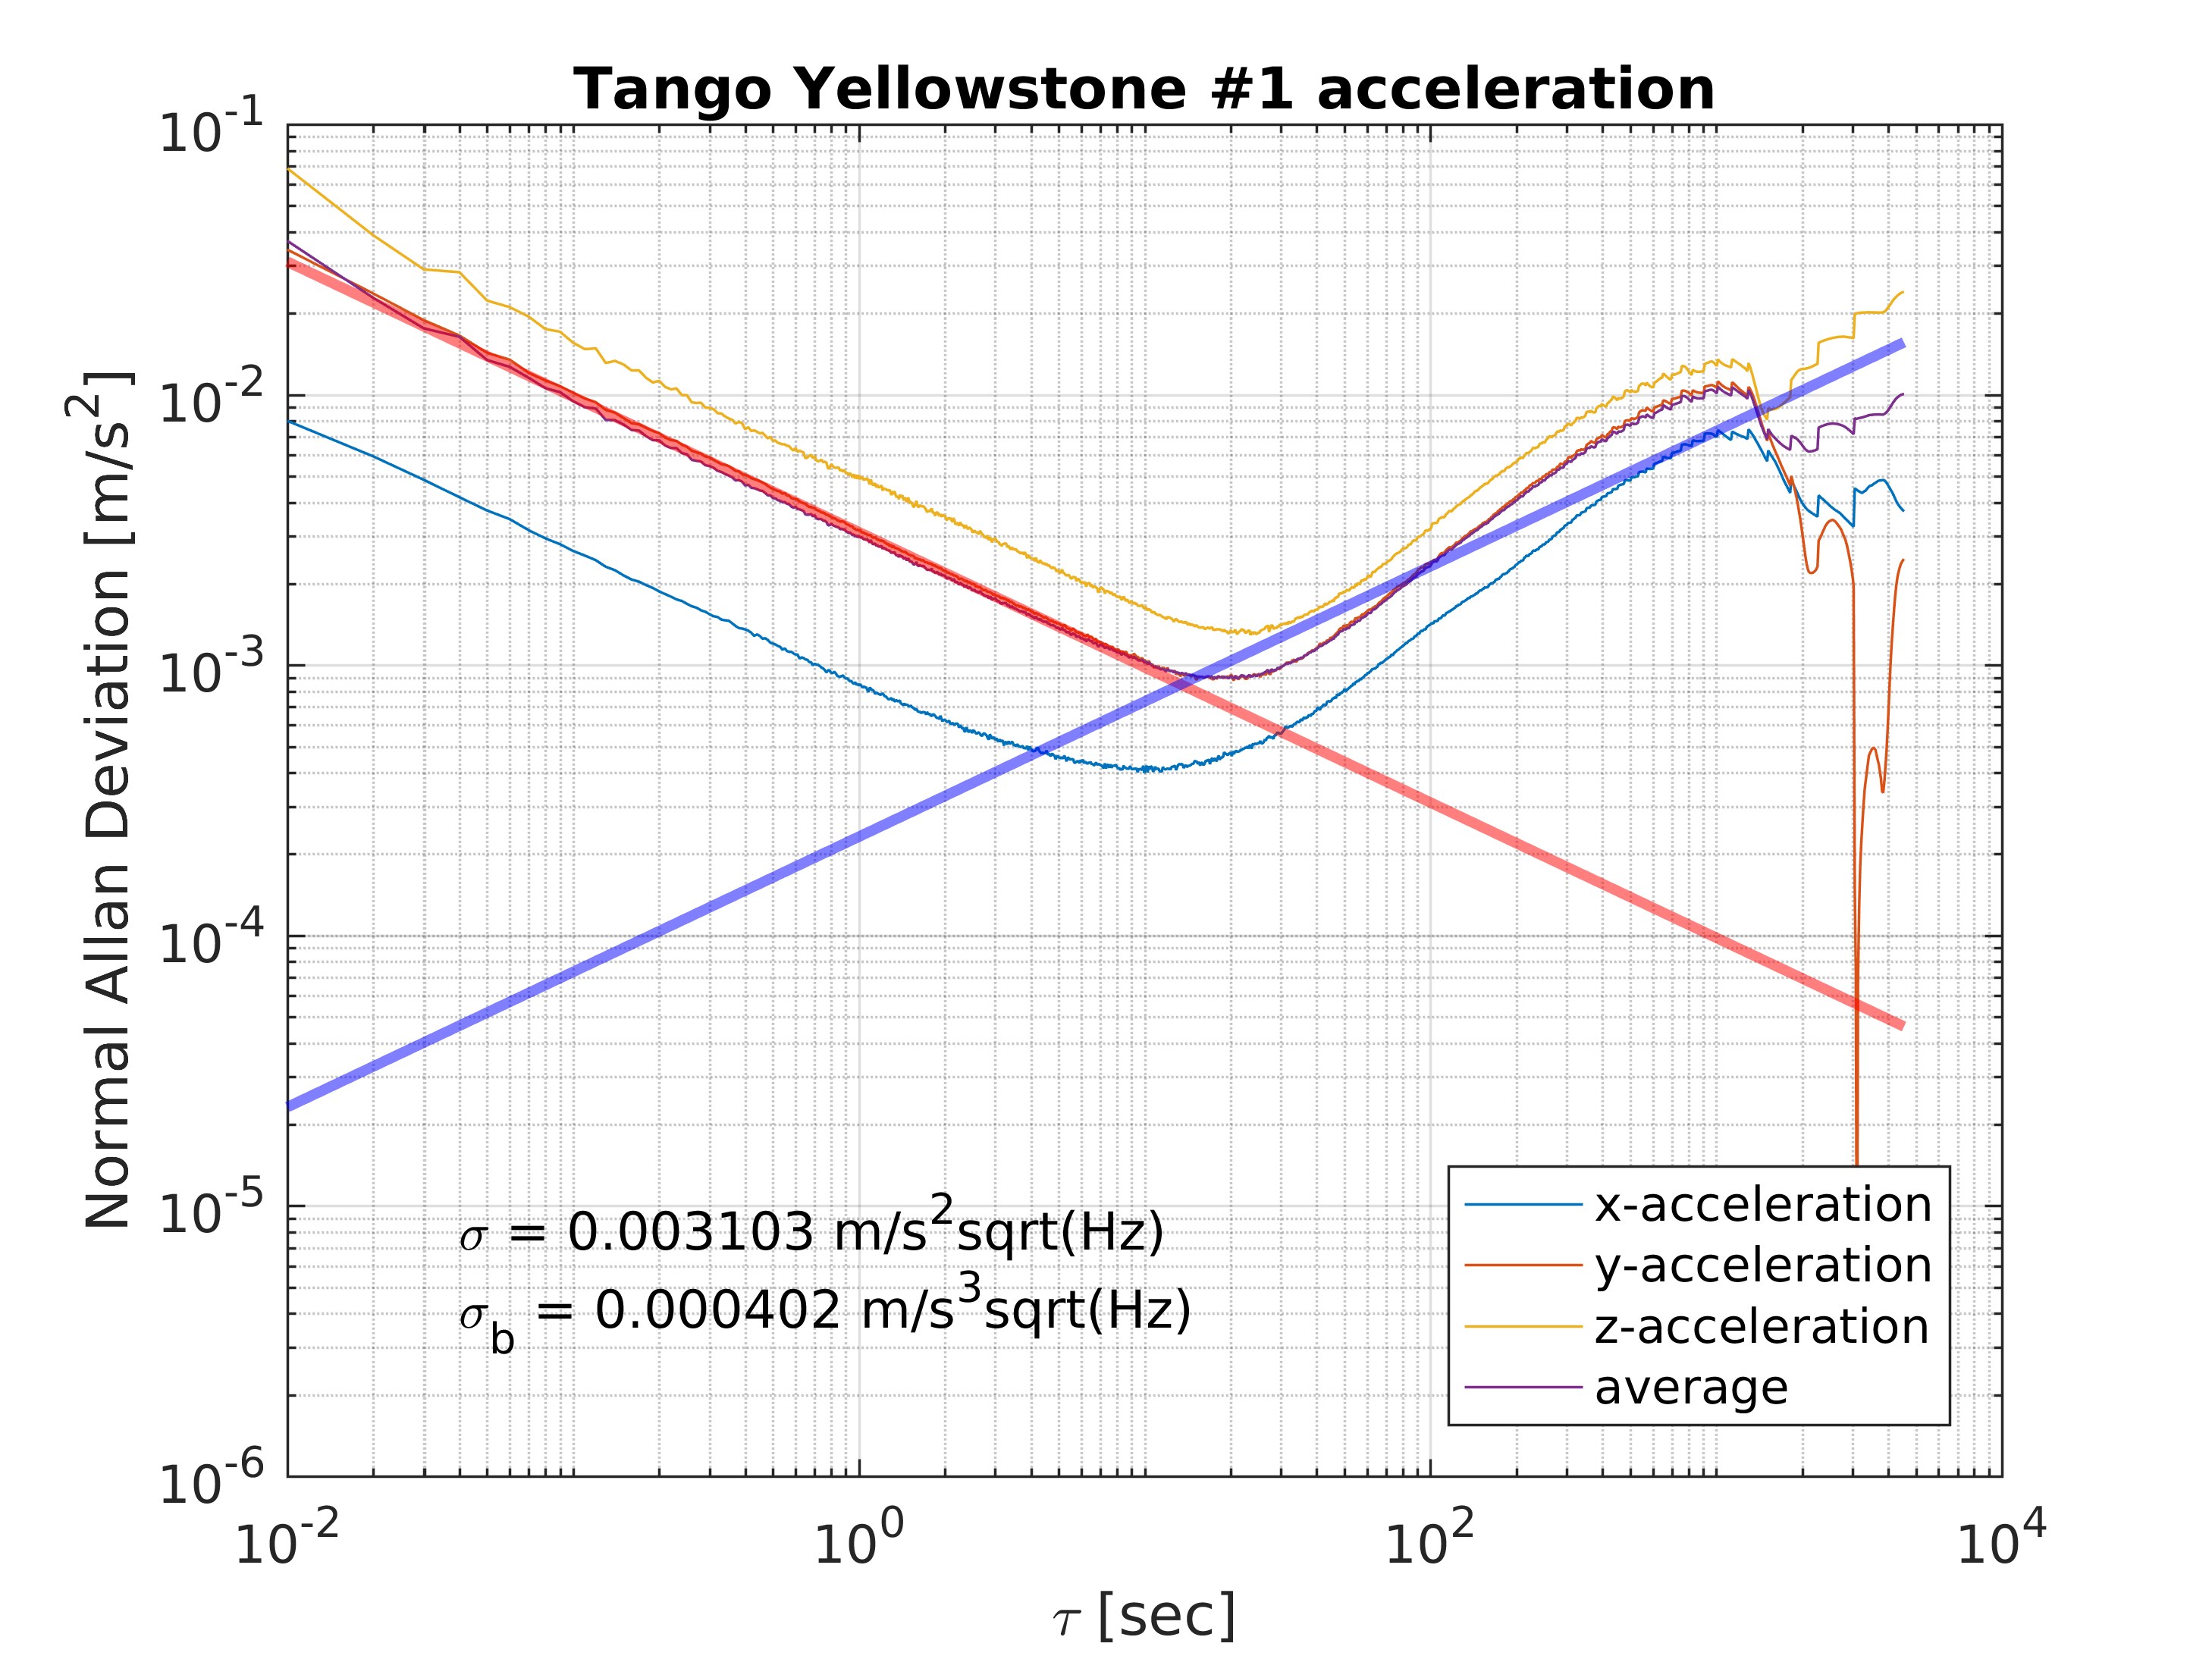
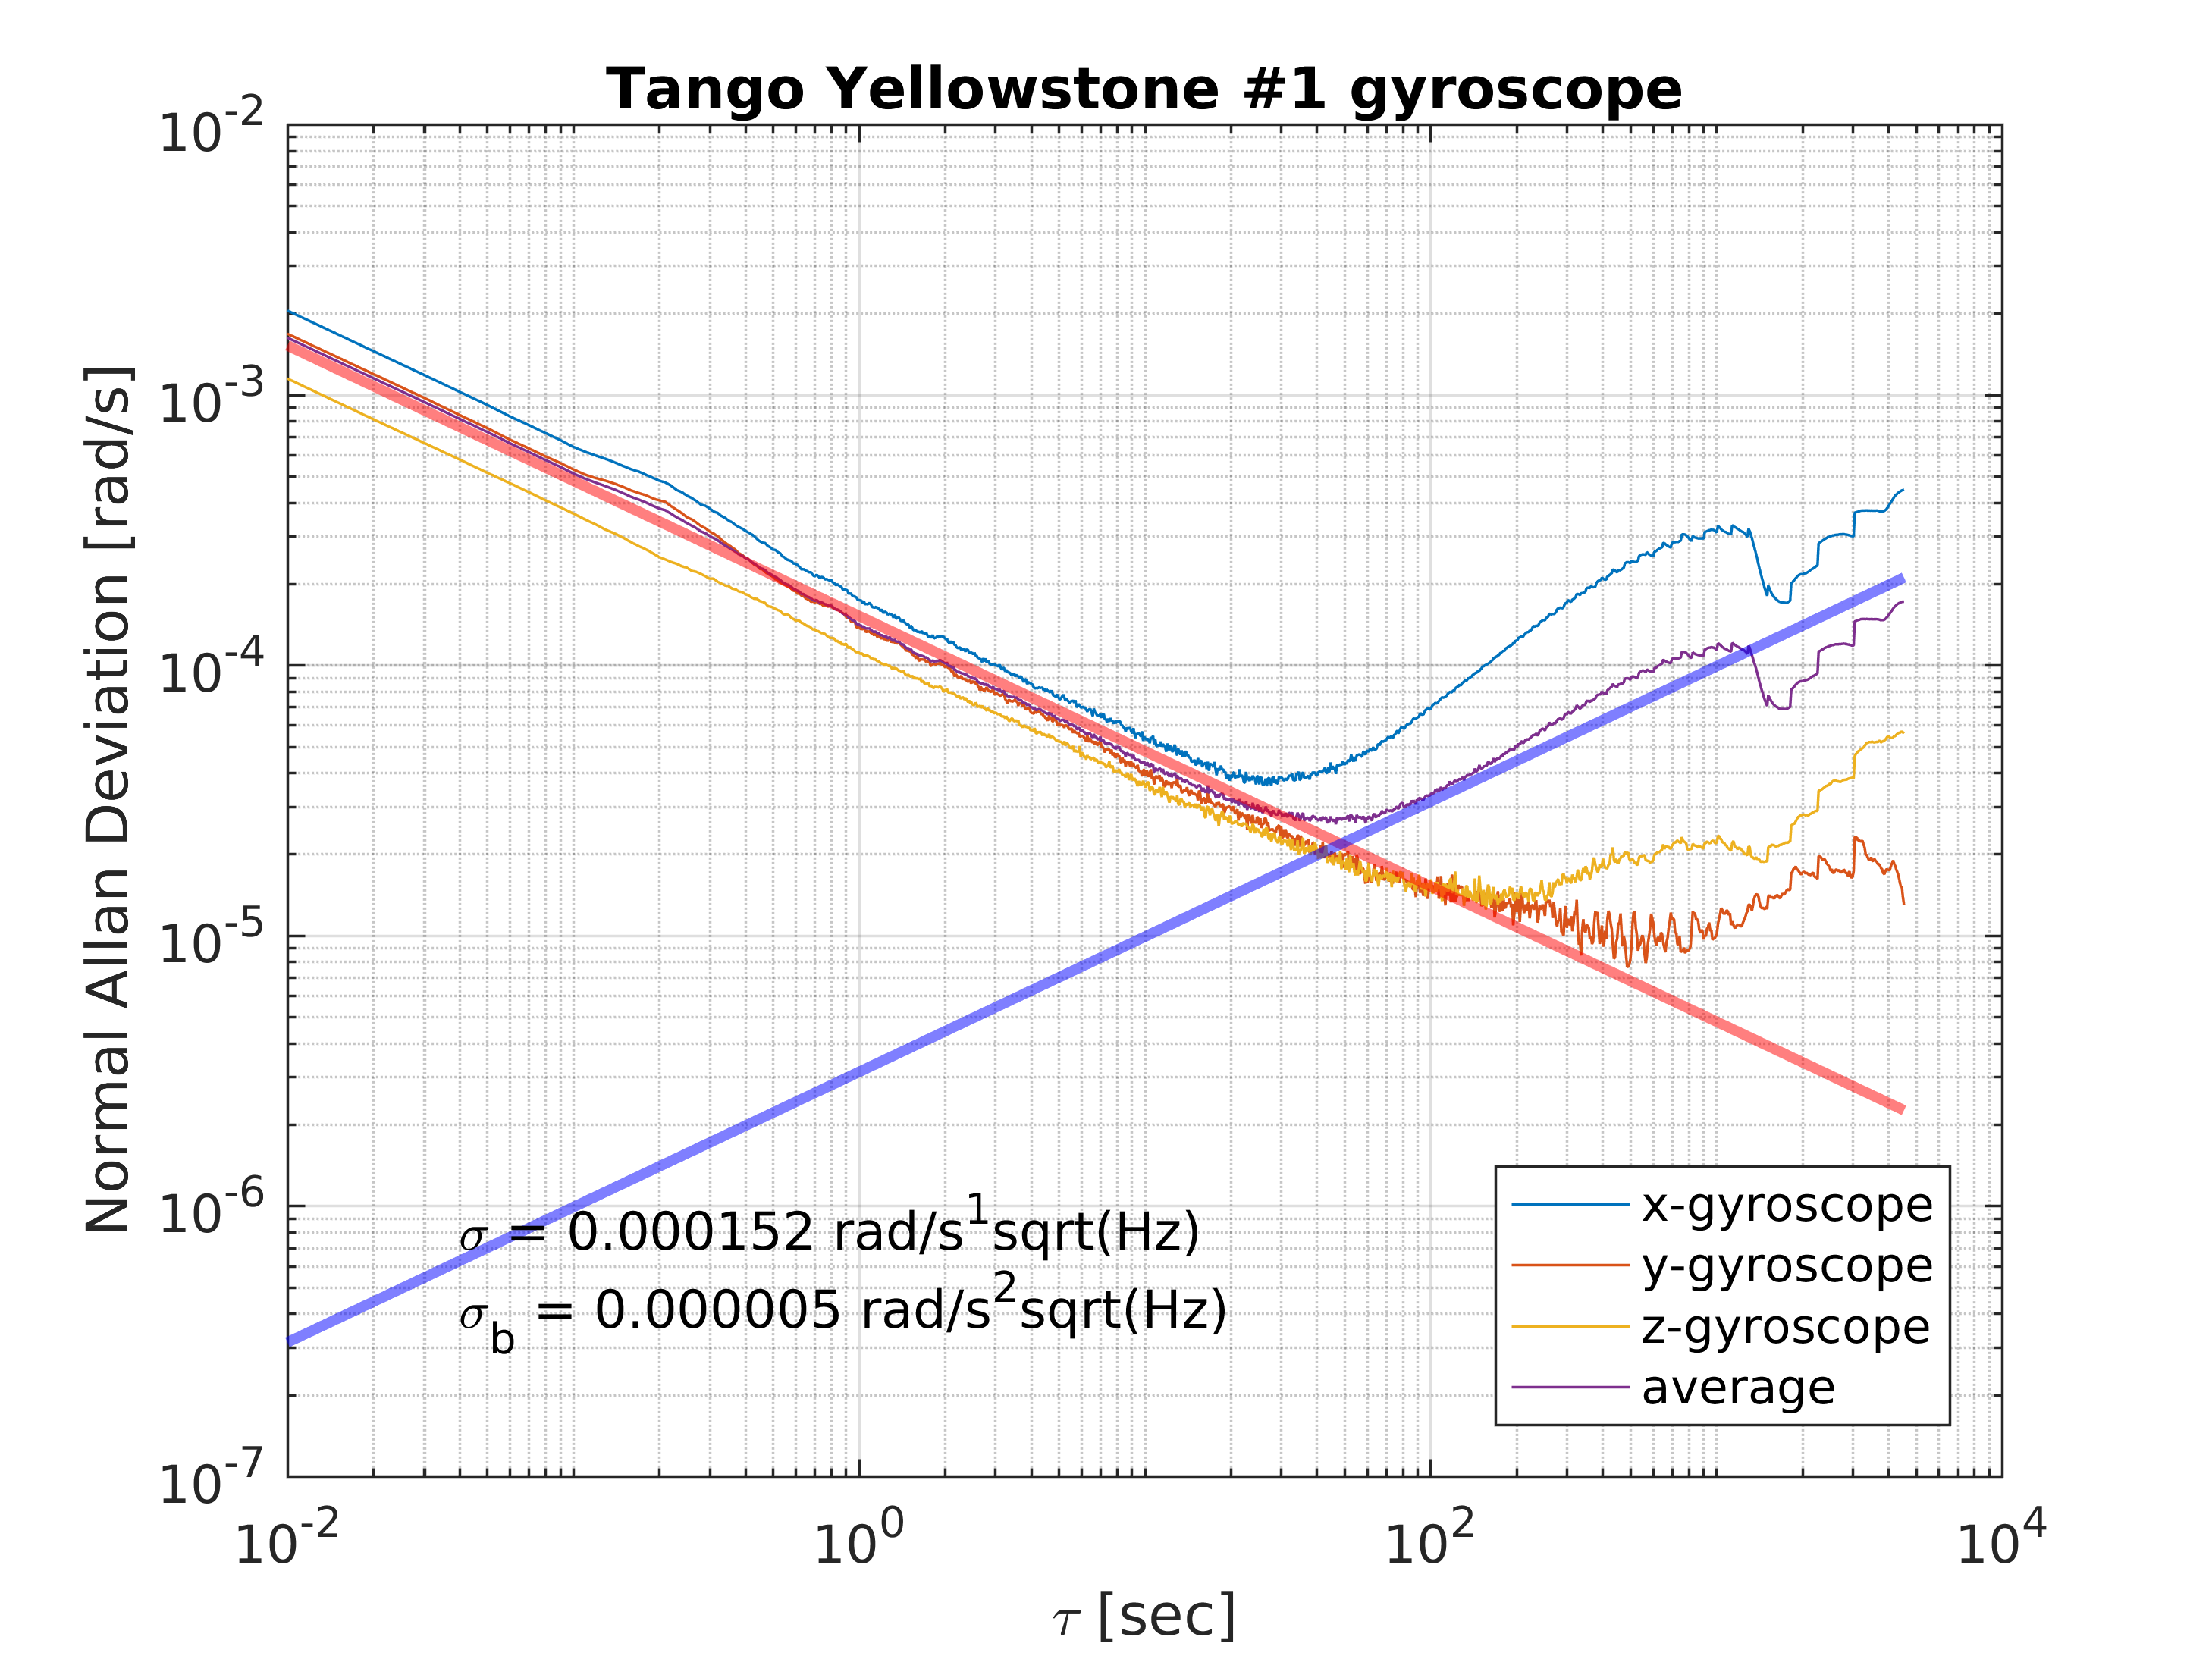
Example Plot - Tango Yellowstone Tablet
Example Plot - ASL-ETH VI-Sensor
Contributors
Showing top 1 contributor by commit count.


